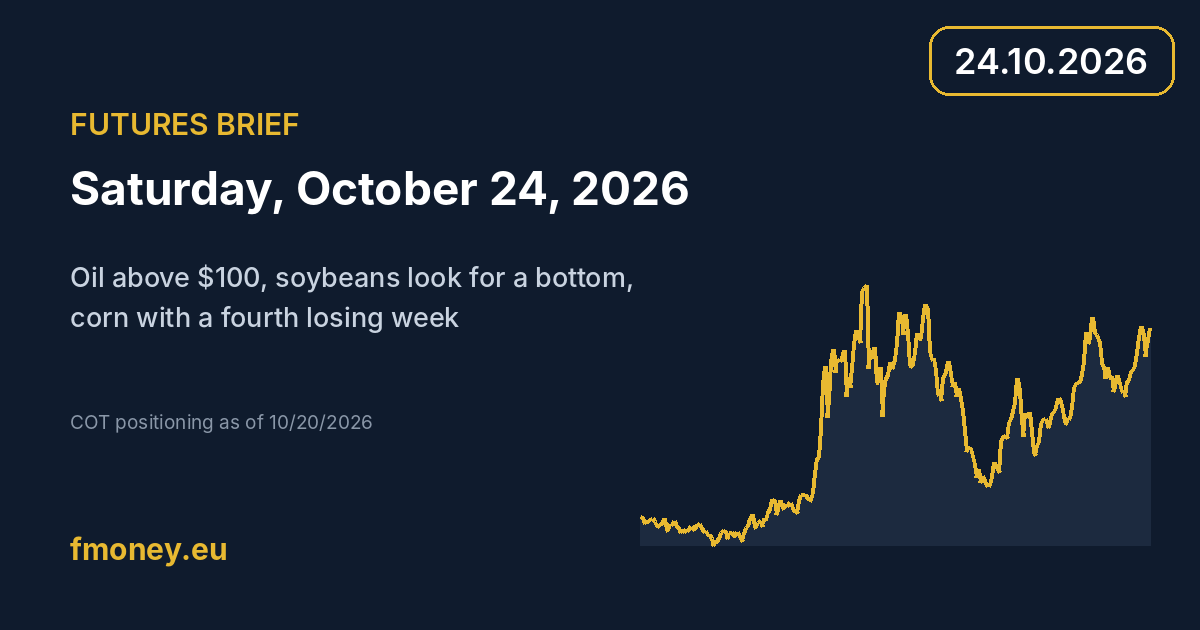
FUTURES BRIEF: Saturday, October 24, 2026
Oil above 100 dollars, soybeans looking for a bottom, and natural gas and hogs with a crowded fund short. Prices from 10/23/2026 compared with COT positioning as of 10/20/2026.
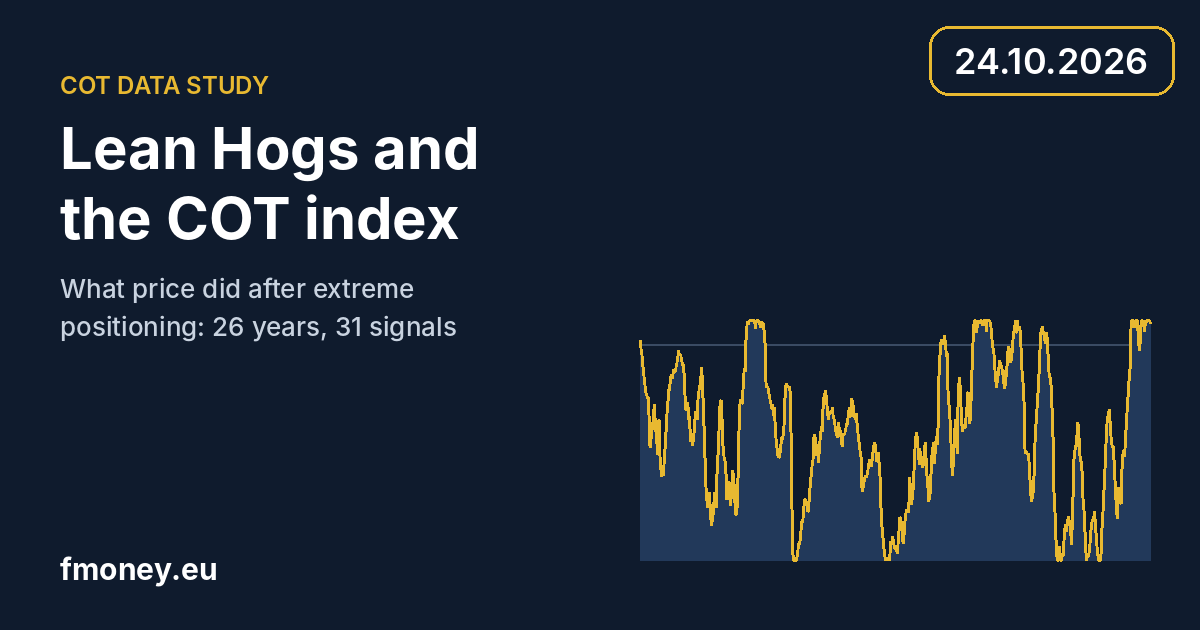
Lean Hogs and the COT index: what 26 years of data show
On October 13, 2026, Commercials in Lean Hogs held their largest net long since 1996. We tested 31 extreme COT signals over 26 years and what price did after them.
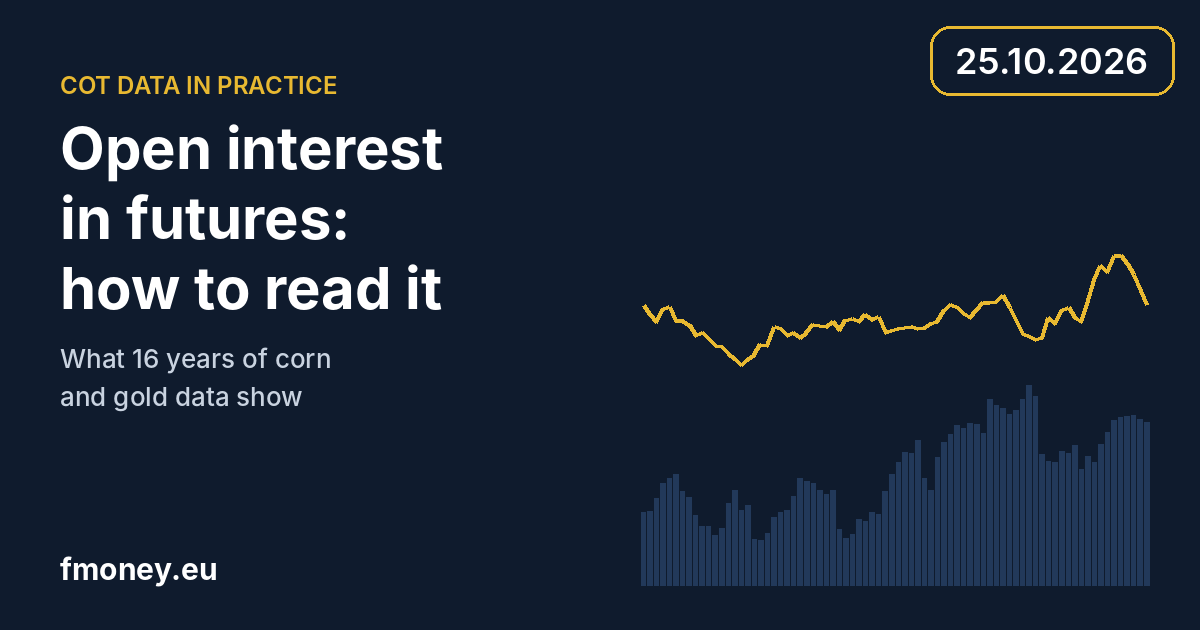
Open interest in futures: how to read it
What open interest really measures and why the classic price table fails a test on 16 years of data. How to read it together with the COT report, with an example from corn in October 2026.
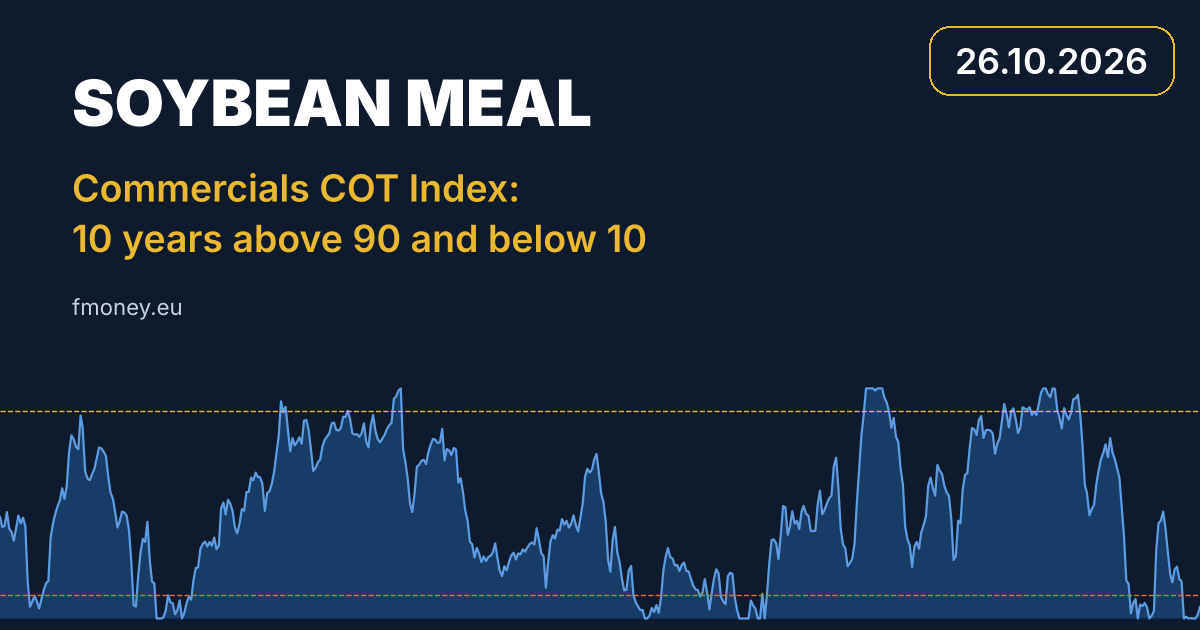
Soybean Meal COT Index: 10 Years of Extremes
Commercials in soybean meal hold their largest net short position in 10 years. We checked every week with a COT Index above 90 and below 10, what followed, and how it lines up with seasonality.

Trade Sequencing: Why Losing Streaks Are Normal
Seven losers out of the last ten does not mean your system has stopped working. Using Monte Carlo simulations, we show how common losing streaks are and why changing your rules mid drawdown is a costly mistake.
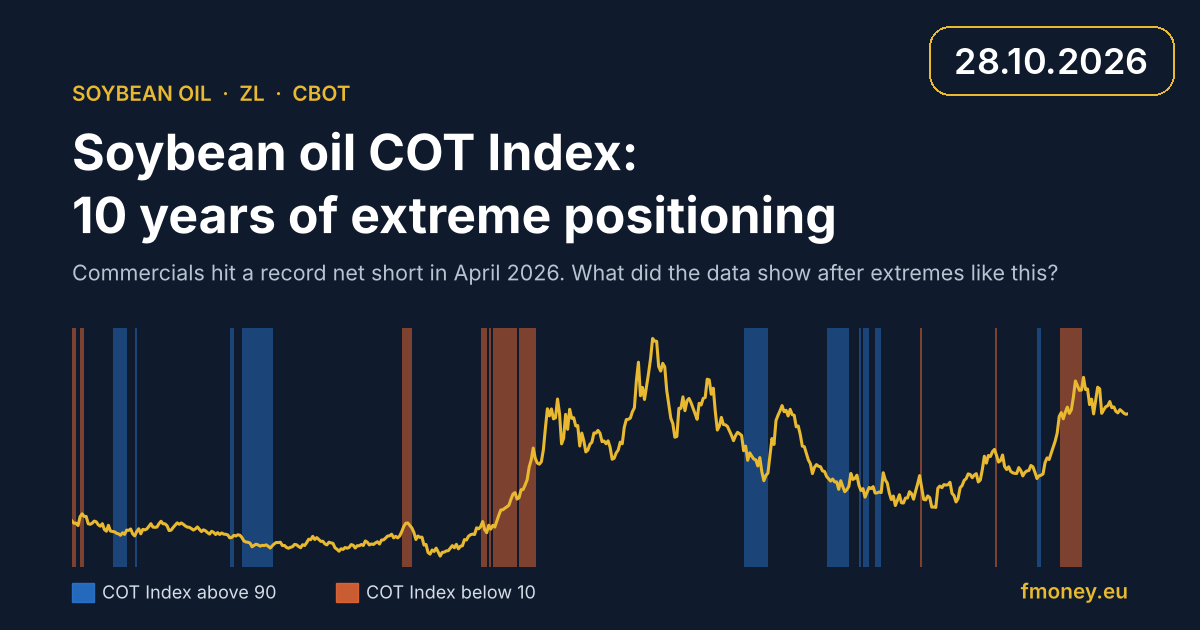
Soybean Oil COT Index: 10 Years of Extreme Positioning
The record Commercial net short in soybean oil from April 2026 has already been half unwound. We checked every COT Index extreme over ten years, what followed each one and what seasonality says into year end.