Soybean Meal COT Index: 10 Years of Extremes
On October 6, 2026, Commercials in soybean meal held a net short position of 244,606 contracts. That is their largest net short position in the past 10 years. How often has the market been at such an extreme, what followed, and does the signal line up with seasonality? We checked every week since October 2016.
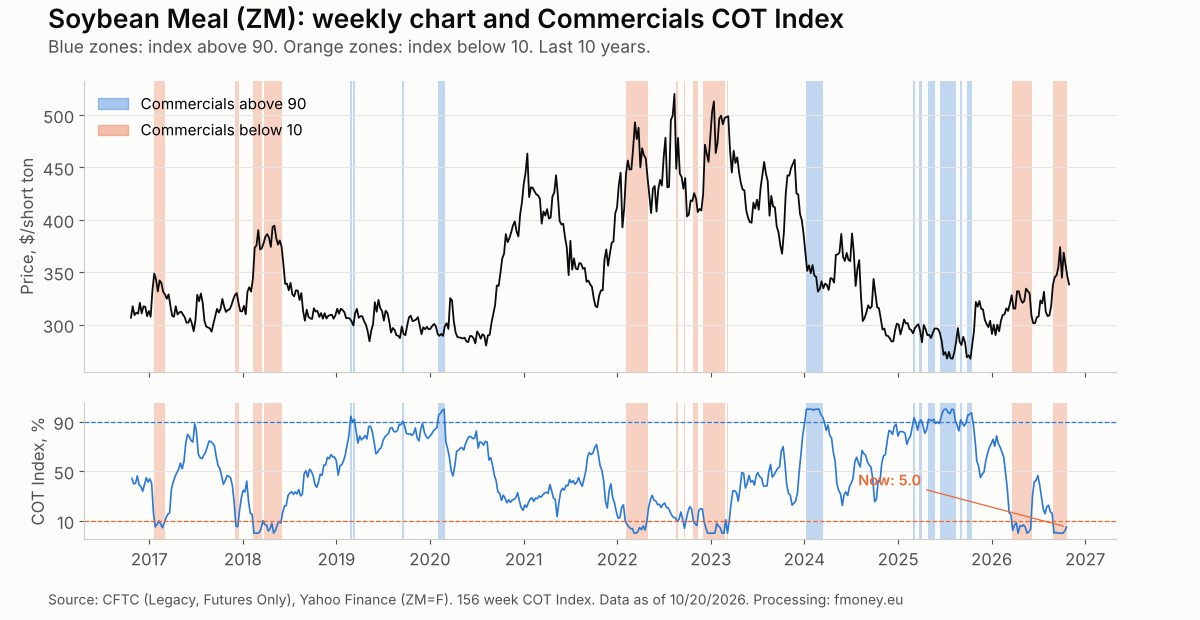
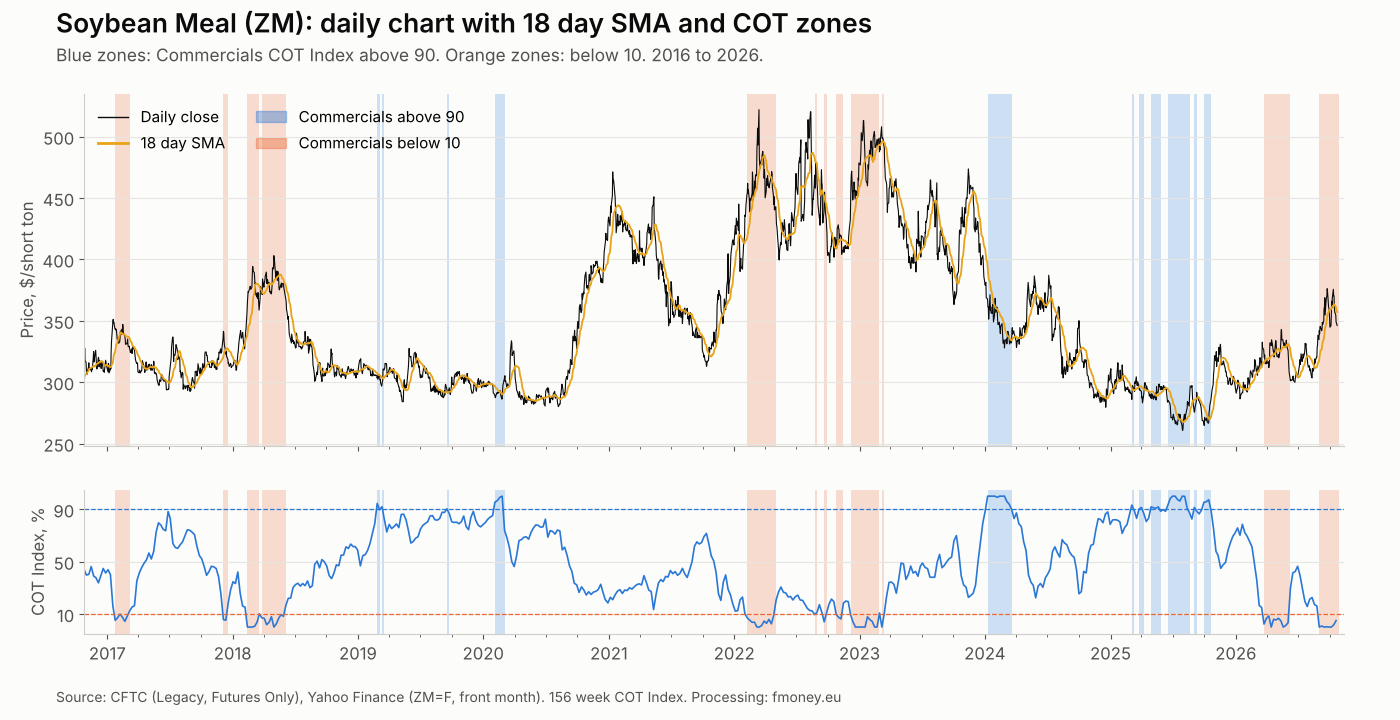
How to read the Commercials COT Index
Commercials are the processors, grain merchants and producers who hedge their physical business. The CFTC's COT report shows their net position (long minus short contracts) every week. On its own the number says little, because Commercials in soybean meal are almost always net short. That is why we put it in context with the COT Index.
COT Index = (current net position − 156 week minimum) / (156 week maximum − 156 week minimum) × 100
An index above 90 means Commercials are close to their largest net long (or smallest net short) position of the past three years. An index below 10 means the opposite: they are selling aggressively and are close to their largest net short position. You can see the index for every market in our free COT demo.
10 years of soybean meal: how often we hit an extreme
From October 25, 2016 to October 20, 2026 there are 522 weekly COT reports for CBOT soybean meal. Of these:
- 37 weeks had an index above 90, spread across 11 separate periods;
- 72 weeks had an index below 10, spread across 12 separate periods.
The two extremes are not evenly distributed. The zone above 90 comes in clusters: early 2019, February 2020, January to March 2024 and almost all of 2025. The zone below 10 dominates 2017 and 2018, 2022 and early 2023, and again 2026.
The most telling moment is 2025. On July 29, 2025, Commercials reached their largest net long position of the entire 10 year period: 64,287 contracts. The next day, July 30, 2025, the front month settled at $260.7 per short ton, the lowest price of the year. Prices then rose to around $345 by September 2026.
There is an important detail, though: the zone above 90 started back in March 2025, four months before the low. Anyone who bought on the first signal had to sit through a further decline of about 12%. COT data shows where pressure is building. It does not give you the exact timing.
What follows the first week in the zone
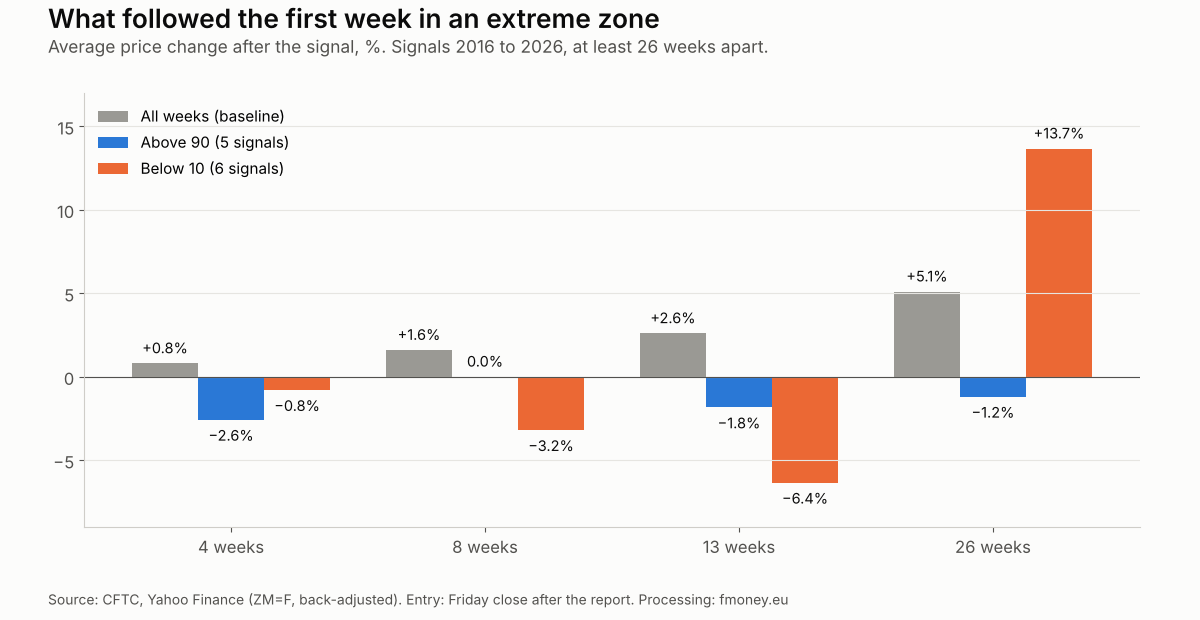
To put numbers on this, we ran a backtest. We take the first week the index enters the zone, with at least 26 weeks between two signals of the same type. Entry is the Friday close after the report date (when the CFTC publishes it). We measure the price change after 4, 8, 13 and 26 weeks and compare it with the average change across all weeks in the period.
| Report date | Index | 4 wks | 8 wks | 13 wks | 26 wks |
|---|---|---|---|---|---|
| Above 90 | |||||
| 02/26/2019 | 94.4 | −1.9% | −4.0% | −0.6% | −10.5% |
| 09/17/2019 | 90.3 | +6.0% | +5.5% | +2.3% | +7.9% |
| 01/09/2024 | 100.0 | −6.5% | −8.0% | −9.5% | −3.2% |
| 03/04/2025 | 93.2 | −7.0% | −4.7% | −6.5% | −11.3% |
| 09/02/2025 | 91.4 | −3.5% | +11.0% | +5.1% | +11.1% |
| Below 10 | |||||
| 01/24/2017 | 5.1 | −3.4% | −7.2% | −9.1% | −1.2% |
| 12/05/2017 | 5.8 | −3.7% | −3.6% | +8.1% | +8.2% |
| 02/08/2022 | 7.0 | +8.0% | +10.6% | −4.0% | +38.0% |
| 08/23/2022 | 9.5 | −2.3% | −9.8% | −11.8% | +20.3% |
| 03/07/2023 | 0.0 | −6.3% | −11.5% | −15.9% | −0.1% |
| 03/24/2026 | 2.3 | +2.9% | +2.3% | −5.4% | +16.8% |
The result is honest and not what the textbook says:
- Below 10 works as a short term warning. 13 weeks after the signal, price was on average 6.4% lower, and only 1 of 6 signals ended higher. For comparison, the average 13 week change across all weeks is +2.6%.
- Above 90 is not a signal to buy right away. 4 weeks after the first week in the zone, price was on average 2.6% lower, and only 1 of 5 signals was positive. Commercials buy into weakness, and their accumulation often runs for months before the low.
- After 26 weeks the picture flips for the zone below 10 (average +13.7%), but that average is pulled up by 2022 (+38.0%) and should not be read as a rule.
The sample is small: 5 and 6 signals in 10 years. This is context for a decision, not a statistically proven system.
Seasonality during these periods
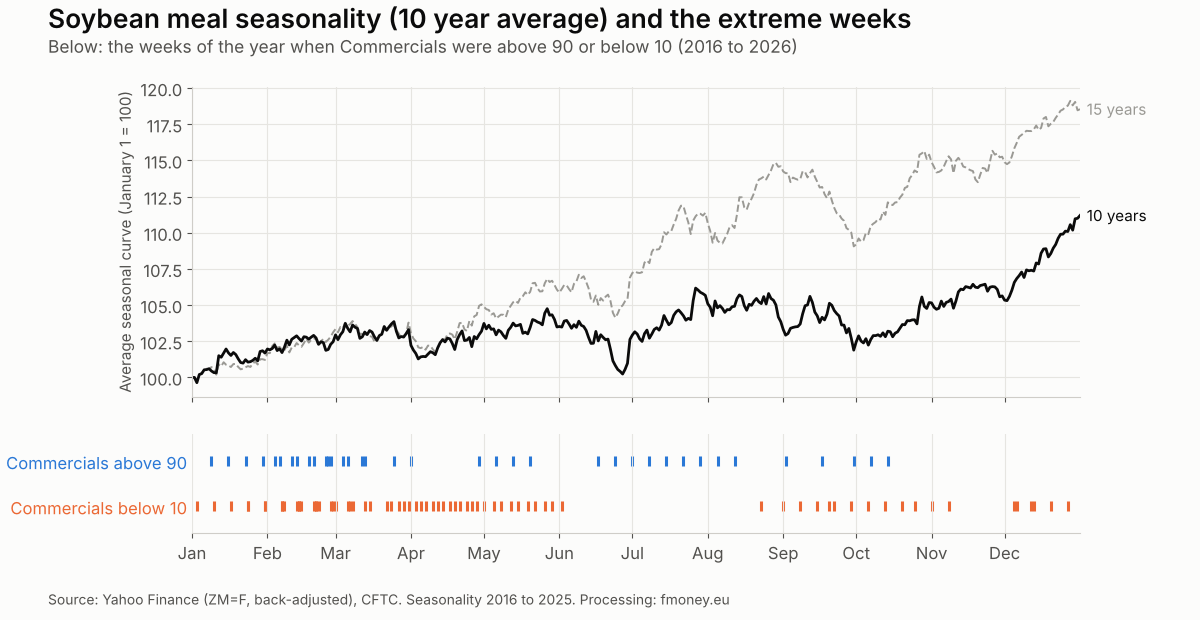
The average seasonal curve for the past 10 years (2016 to 2025) has a clear shape:
- January to mid June: a slow climb of about 2% to 4%;
- late June: a sharp drop, bottoming around June 27;
- July: a strong rally to a peak around July 27 (about +6% from the start of the year);
- August and September: weakness into a low around September 30;
- October to late December: the strongest seasonal stretch, with the year ending up about 11% on average.
Extreme Commercials positions have a calendar of their own. Weeks below 10 cluster from January to May (52 of 72 weeks) and in December. There was not a single week below 10 in July. Weeks above 90 are most frequent in February and March, and then in summer, when prices are pressured around the South American harvest and ahead of the US crop.
There is also an interesting divergence. For the signals below 10, the seasonal curve pointed to roughly +1% over the following 8 weeks on average, while the actual result was −3.2%. In other words, when Commercials were at an extreme short, the COT picture outweighed seasonality.
Where we are now
According to CFTC data as of October 20, 2026:
- Commercials net position: −229,210 contracts (COT Index 5.0);
- Large Speculators net position: +206,000 contracts;
- open interest: 635,401 contracts;
- soybean meal has been in the zone below 10 since September 1, 2026, now 8 consecutive weeks.
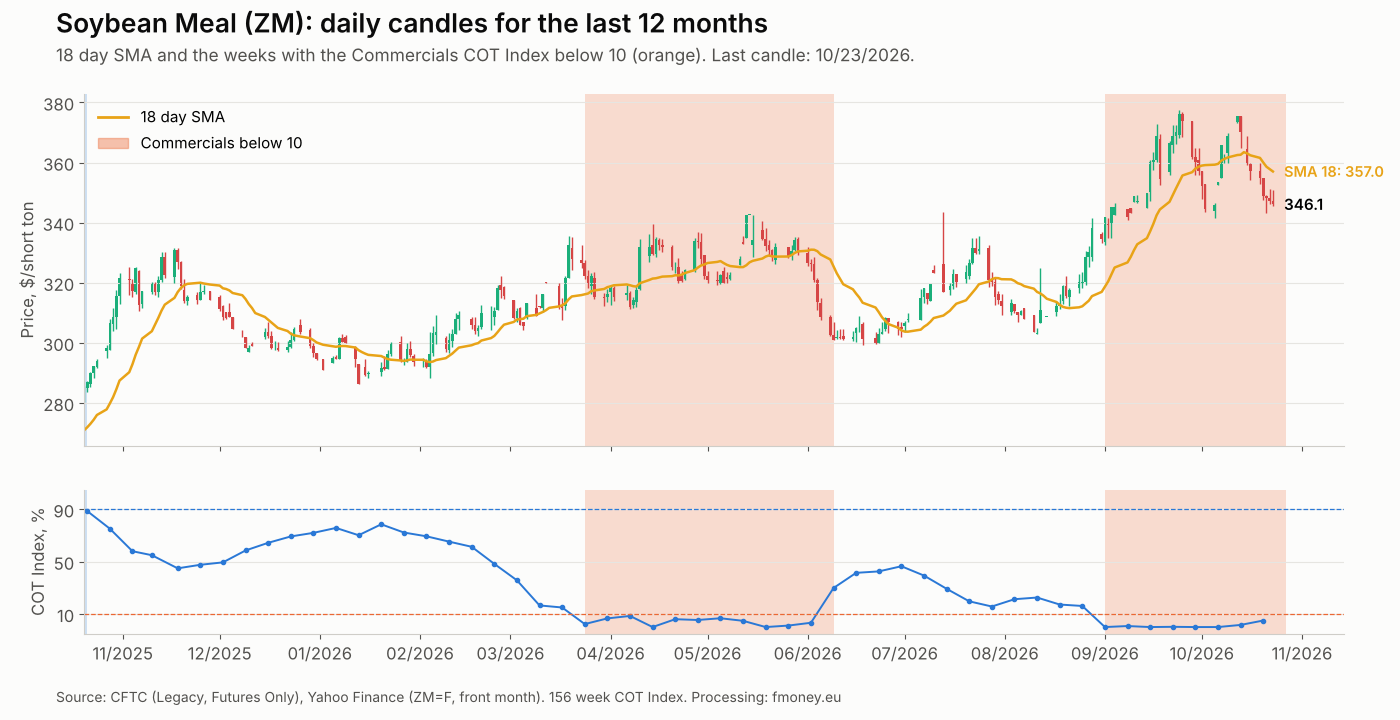
The daily chart adds an important detail. Price peaked at 377.6 on September 24, 2026, and since October 15 it has closed below the 18 day moving average for 7 straight sessions. On October 23 it settled at 346.1 against an 18 day SMA of 357.0, and the average is now turning lower. In other words, short term price momentum currently agrees with the COT warning, not with seasonality.
Under our 26 week spacing rule this is not a new signal but a continuation of the zone that began in March 2026. The index has risen from 0 to 5.0 over the past two weeks, meaning Commercials have started to cover some shorts.
Here the two frameworks disagree. Seasonality from late October to late December is the strongest stretch of the year: about +7% on average over 10 years. COT positioning, however, remains at an extreme short, which has historically warned of weakness over the next 8 to 13 weeks. When the two tools disagree, that argues for a smaller position size or for waiting, not for an aggressive trade.
5 mistakes when trading COT extremes
- Entering on the first week in the zone. The 2025 example shows Commercials can stay above 90 for months while price keeps falling.
- Ignoring price. The COT Index is a directional filter. The entry comes from price structure: a breakout, a reversal, a retest of a level.
- Using seasonality without context. The average curve is an average of very different years. It does not tell you what will happen this year.
- Trading big on a small sample. 5 or 6 signals in 10 years is not statistics. Use the risk calculator and a fixed percentage risk.
- Watching only one index. Also check open interest and what Large Speculators are doing on the other side.
How we use it in practice
In our strategy, Commercials positioning is a mandatory filter: we do not look for longs when the commercial hedgers are at an extreme short, and vice versa. Seasonality and price structure decide the timing. In soybean meal right now the filter says "be careful with longs," while seasonality says "a strong period is ahead." We wait for price to show which signal wins.
Frequently asked questions
How many times has the soybean meal COT Index been above 90 in 10 years?
37 weeks out of 522, spread across 11 separate periods. The longest ran from June 17 to August 12, 2025 (9 weeks).
How many times has it been below 10?
72 weeks in 12 periods. The longest ran from February 8 to April 26, 2022 and from December 6, 2022 to February 21, 2023 (12 weeks each).
Why do you use 156 weeks for the COT Index?
Three years cover several seasonal cycles and several crops. A shorter window gives more signals, but also more noise.
How did you calculate prices and seasonality?
We use the continuous front month ZM=F, back-adjusted at contract rolls so that the gaps between contracts are not counted as price moves. The weekly chart shows the actual front month price.
Is this a signal to sell soybean meal now?
No. This is an analysis of historical data. COT positioning is a warning, but seasonality points the other way, and the entry should always come from price and from your own risk management.
Conclusion
Over 10 years, Commercials in soybean meal were at an extreme in roughly one of every five weeks. The zone below 10 was a more reliable short term warning than the zone above 90 was as a buy signal. Today we are at the commercial hedgers' largest net short position in a decade, right before the seasonally strongest stretch of the year. That is a situation worth following week by week.
You can follow the current COT Index for soybean meal and dozens of other markets in the free demo, while the weekly analyses and full toolset are available in our membership plans.
Sources: CFTC Commitments of Traders (Legacy, Futures Only), data as of 10/20/2026; Yahoo Finance (ZM=F). Calculations: fmoney.eu. Futures trading involves a high risk of loss. This content is for educational purposes and is not investment advice. Past performance does not guarantee future results.