Trade Sequencing: Why Losing Streaks Are Normal
Seven losing trades out of the last ten. At that point most traders ask the same question: "Has my system stopped working?" Most of the time the answer is no. They have simply hit a bad run. In this article you will see, in numbers, how common such streaks are even for a perfectly sound system, what Monte Carlo simulations reveal, and why changing your rules in the middle of a drawdown is one of the most expensive mistakes in futures trading.
A coin has no memory
Imagine flipping a coin 200 times. You know heads and tails will come up roughly equally. But if someone asks how long the longest run of tails will be, intuition usually says 3 or 4. The real answer is about 7.
Rules-based trading behaves the same way. Every trade is a separate event. The market does not know that your last five trades were losers, and it does not "owe" you a winner on the sixth. That is why win rate on its own tells you very little. It describes average behavior over hundreds of trades, not what will happen over the next ten.
Many traders believe that long losing streaks are rare with a 50% win rate. The math says the opposite: they are certain. The only questions are when they will arrive and whether you will be prepared.
How many losses in a row are normal with a 50% win rate
We ran a simple experiment: 200 trades, each with exactly a 50% chance of winning. We then checked every rolling window of 10 consecutive trades (there are 191 of them) and counted the losses in each.
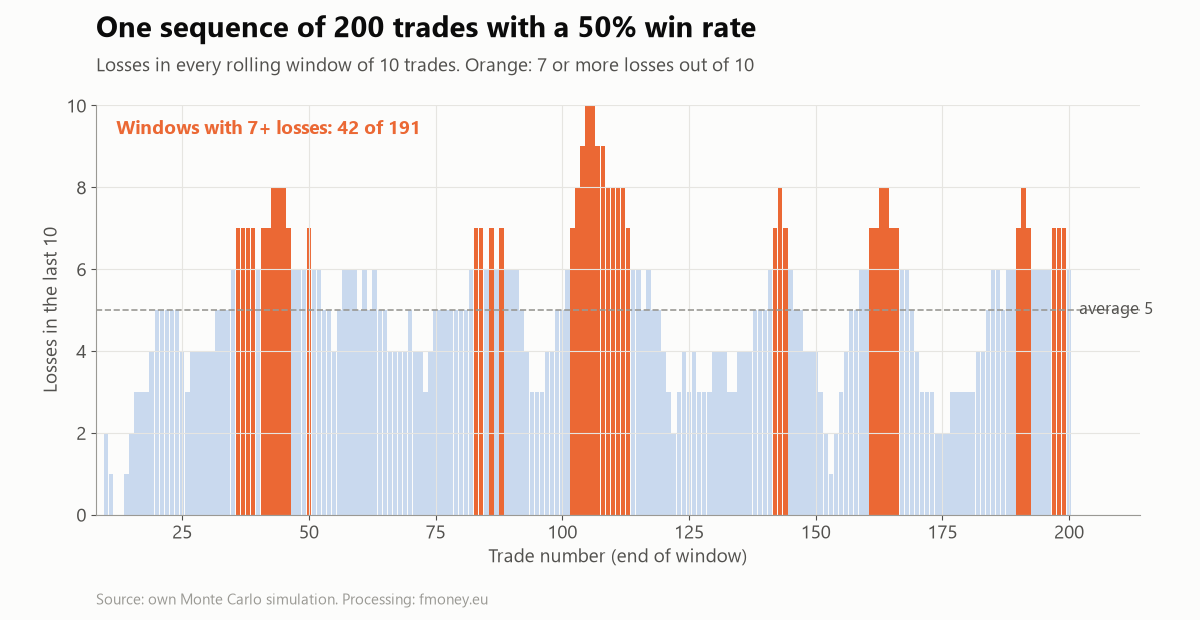
In this particular sequence, 42 windows have 7 or more losses. That is not an outlier. Calculated exactly, the probability that 10 random trades contain at least 7 losses is 17.2%, and at least 8 losses is 5.5%. Applied to 191 windows, that means on average:
- about 33 windows with 7 or more losses out of 10;
- about 10 windows with 8 or more losses out of 10.
Across 100,000 simulations the averages matched the calculation (32.8 and 10.4), and in 80% of cases the number of windows with 7+ losses was between 16 and 51. In other words, if you trade around 100 times a year, you should expect several periods each year in which 7 or 8 of your last 10 trades are losers. If that surprises you, the problem is not the system but your expectations.
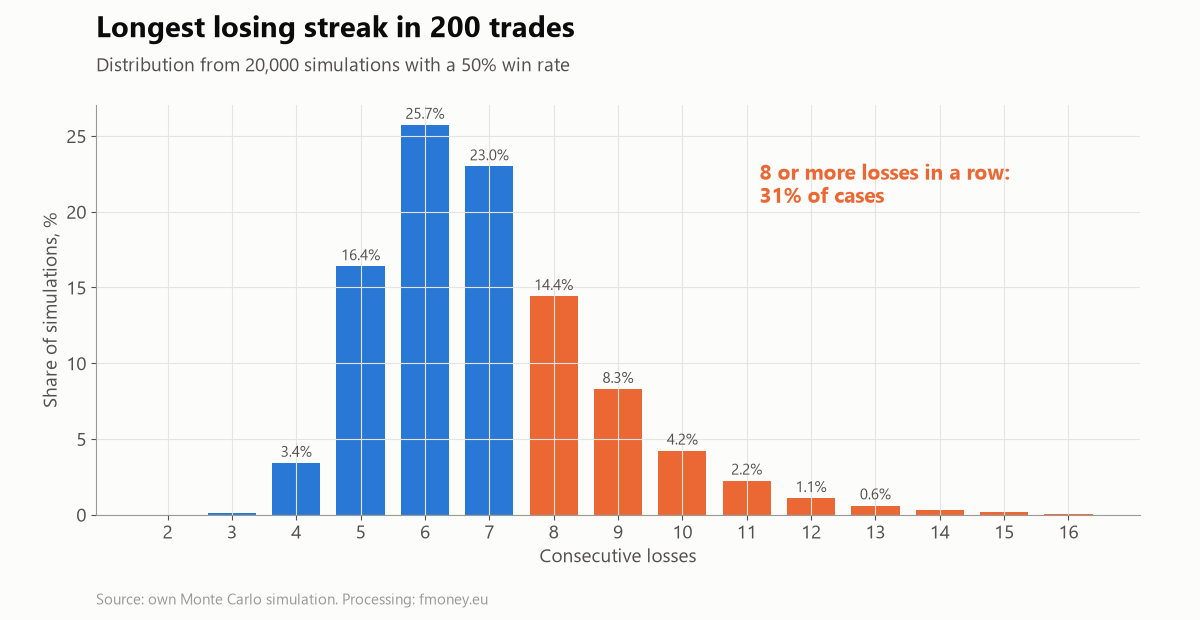
The longest losing streak in 200 trades is 6 or more in 80% of cases, 8 or more in 31%, and 10 or more in almost 9% of cases. If you risk 1% per trade, 10 consecutive losses mean a drawdown of about 10%. Unpleasant, but entirely survivable if you expected it and your position sizing allows for it.
Monte Carlo: one system, a hundred different fates
A Monte Carlo simulation lets you see not just the average result of a system but the full range of possible outcomes. You take the core parameters (win rate, average win, average loss, risk per trade) and shuffle the order of trades thousands of times. Each shuffle is an "alternative history" that could have happened with exactly the same rules.
For this example we used a hypothetical system with a positive expectancy:
- 50% winning trades;
- every loss is 1R (R is the risk set at entry), average win 1.3R with dispersion;
- 1% of equity risked per trade;
- 300 trades, or about 3 years at 100 trades a year.
Expectancy per trade = 0.5 × 1.3R − 0.5 × 1R = +0.15R. A modest but realistic edge, the kind many working systems have.
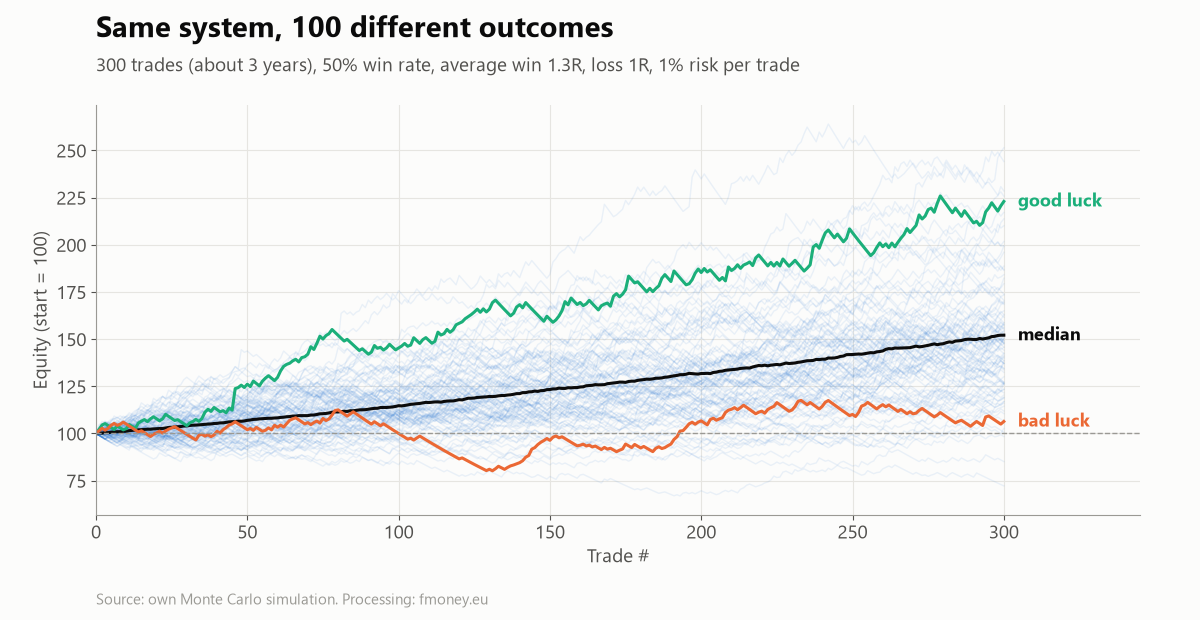
Results from 10,000 simulations:
| Metric | Value |
|---|---|
| Median ending equity (start 100) | 153 |
| Worst 5% / best 5% of scenarios | below 107 / above 221 |
| Worst / best scenario | 67 / 381 |
| Below starting equity after the first 100 trades | 13.4% of cases |
| Below starting equity after 300 trades | 2.5% of cases |
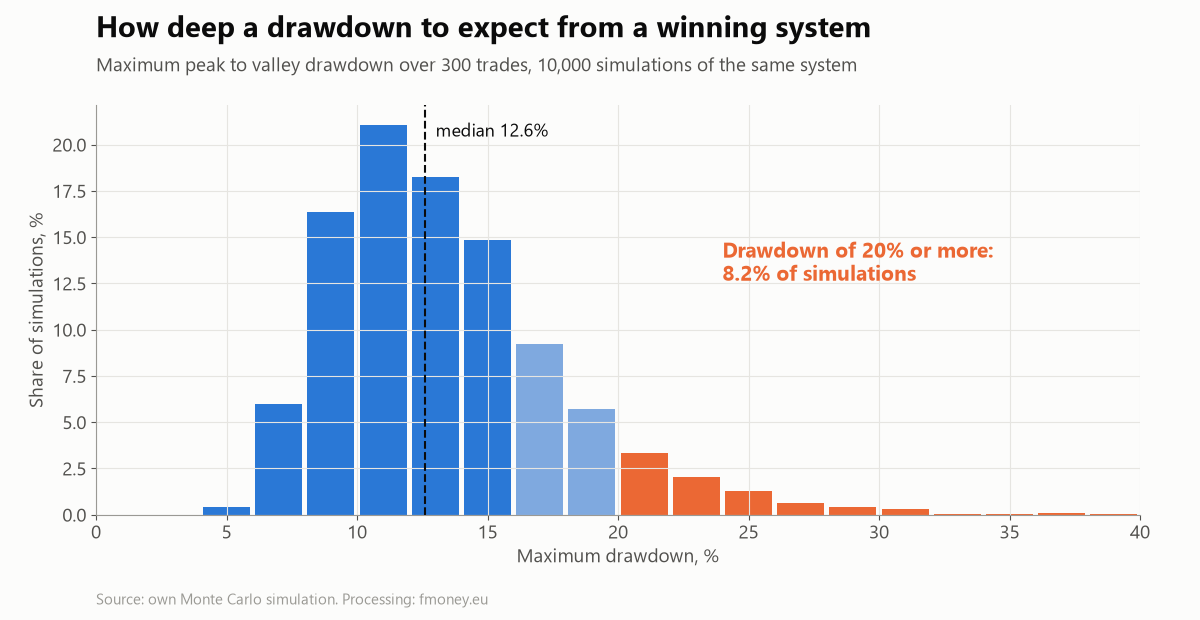
| Median maximum drawdown | 12.6% |
| Drawdown of 15% or more / 20% or more | 30% / 8.2% of cases |
| Longest stretch below a prior peak (median) | 83 trades |
Look closely at two rows. First, in roughly one simulation out of seven, the trader is down after a full year of trading a winning system. Second, the typical longest stretch without a new equity high is 83 trades, and in 10% of cases it is 168 trades or more. That is months, sometimes more than a year, in which everything feels wrong when in fact it is just statistics.
If two people trade in exactly the same way, one can finish three years having doubled the account while the other is barely above breakeven. The first will think they are a genius. The second will think the system is broken. Both will be wrong.
Three kinds of mismatch
When the results of a rules-based system deteriorate, the cause is usually one of three things:
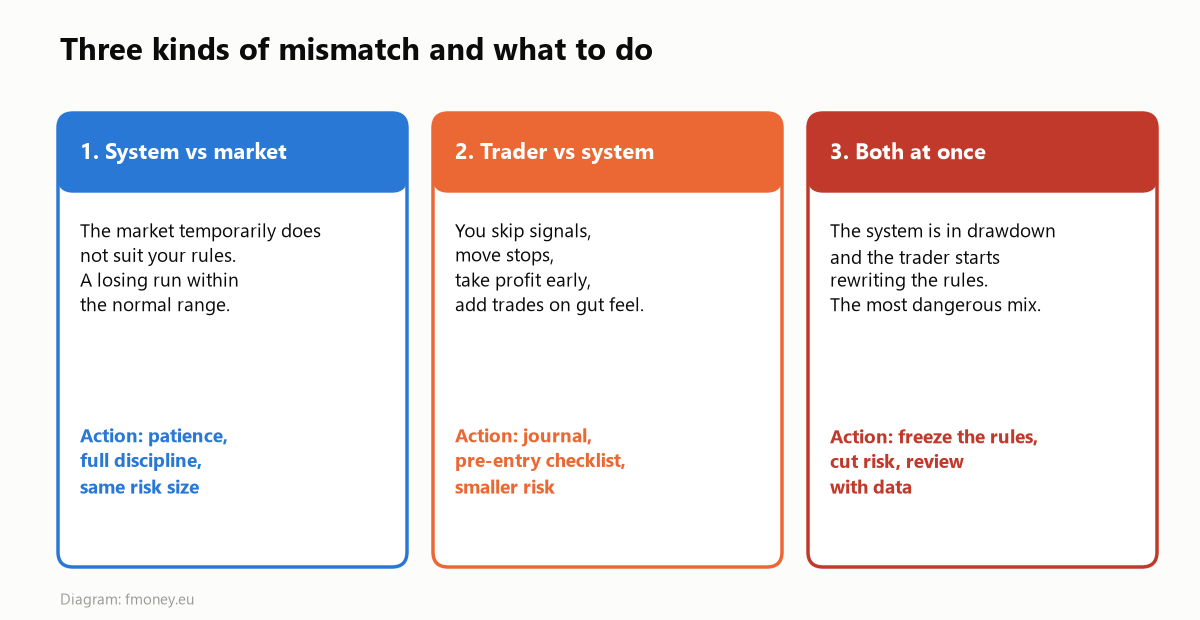
- The system is out of sync with the market. For example, a trend following system during months of sideways action. This is normal and temporary. The rules are not wrong; the environment simply is not giving them opportunities.
- The trader is out of sync with the system. Skipping signals after a few losses, moving the stop "just this once", taking profits early out of fear. The result is no longer the system's result; it is the result of emotions.
- Both at once. The system enters a normal drawdown, the trader gets nervous and starts changing the rules. This exact combination has destroyed more accounts than any market shock.
Why changing the rules in a drawdown costs so much
The mechanism is simple. A drawdown is deepest precisely when the market does not suit the system. If you change the rules at that moment, you are effectively fitting a new system to the last few months, which were the least favorable for the old one. When the market returns to conditions in which the old system makes money, you are no longer using it. You take all the pain of the drawdown and miss the recovery.
On top of that, every change resets your statistics. New rules have no track record, no proven edge, and you do not know what their normal drawdown looks like. That is how a drawdown of 8 to 10%, which would have ended within a few months, easily turns into one twice as deep and far longer.
Almost every decade has its own story about how "the markets are different now". It was computerized trading, then high frequency algorithms, and today it is artificial intelligence. Markets do change, but slowly. The fear and greed of market participants, on which classical approaches rest, have not changed. Before you conclude that your approach is obsolete, check whether your drawdown even falls outside the normal range of a Monte Carlo simulation.
The single trade optimization trap
The second common mistake is rewriting your rules because of one or two memorable trades. Two typical situations:
- You exit with a good profit, and the market keeps running in your direction for a long time. You could have made two or three times as much. The temptation is to loosen your exit rules.
- You ride a trend that suddenly reverses and gives back almost all of the open profit. The temptation is to tighten your exit.
The two changes contradict each other, yet both seem logical in the moment. The problem is that a single trade carries no statistical information.
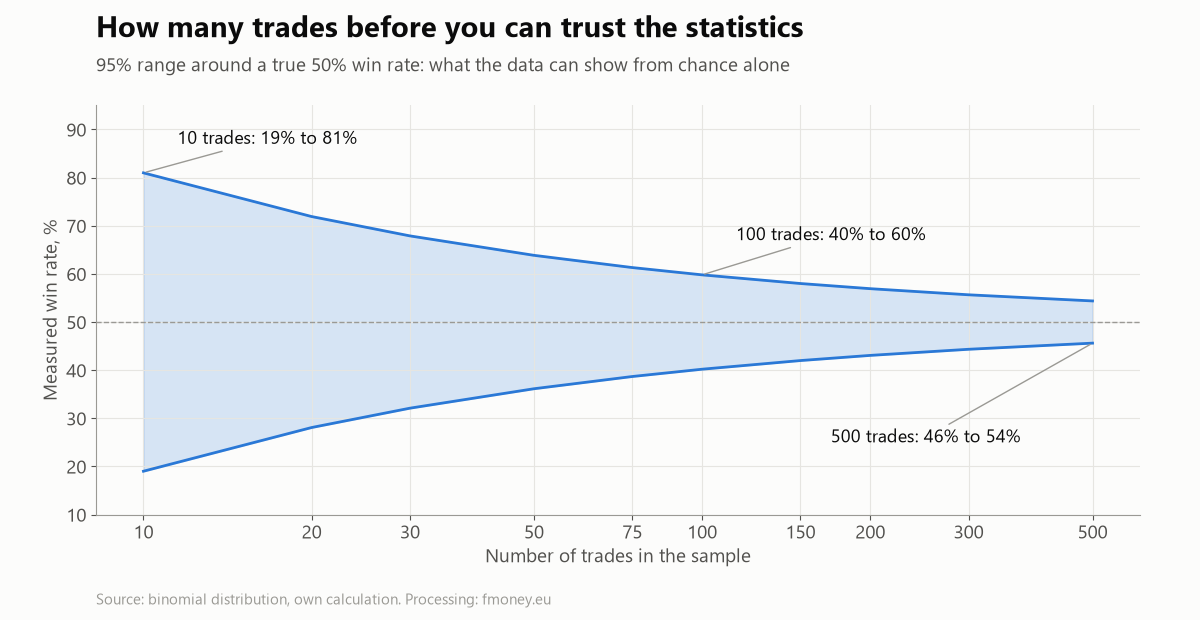
The chart shows how much noise there is in small samples. Over 10 trades, the measured win rate of a system with a true 50% can be anywhere between 19% and 81%. Over 100 trades the range is 40% to 60%, and only at 500 trades does it narrow to between 46% and 54%. Any decision based on fewer than a few dozen trades is a decision based on noise.
There is a deeper problem too: the pursuit of optimization itself. The more precisely you fit parameters to the past, the worse they usually perform in the future, because market behavior changes from year to year. A good system is not the one that perfectly caught the best trades of the past. It is the one that delivers an acceptable risk adjusted return across many different market environments. That is why professionals look at metrics such as the profit factor (gross profit divided by gross loss) and the Calmar ratio (annual return divided by maximum drawdown), not the number of "perfect" trades.
A practical framework: simple rules, forward testing, patience
A complete trading system has to answer at least eight questions:
- Which markets do I trade?
- Which setups do I take and which do I reject?
- What is my position size?
- How exactly do I enter?
- What is my initial risk and where is my stop?
- How and when do I move my protective stop?
- Do I add to winning positions (pyramiding), and by what rules?
- When and how do I take profits?
The answers do not need to be complicated. On the contrary, simple rules are more robust. Three principles cover most of them:
- Cut losses quickly. The stop is set at entry and never moved further away.
- Size conservatively. Risking between 0.5% and 1% per trade lets you survive 10 consecutive losses without a psychological breakdown. Use the risk calculator to work out the number of contracts.
- Let winners grow. Positive expectancy comes from the few large winners, not from a high win rate.
Then start forward testing the rules in real time with small risk. Make adjustments rarely and keep them small, roughly every 100 trades, once there is enough data to separate signal from noise. Between reviews, the rules are frozen.
Your trade journal is your most valuable asset
Without data, every assessment of a system is just an impression. Keep a database in which you record at least the following for each trade:
- entry and exit dates, market and direction;
- setup and reason for entry;
- initial risk in R and in money;
- result in R and as a percentage of total notional capital;
- whether the trade was executed fully according to the rules (yes or no) and, if not, what the deviation was.
The "according to the rules" column is the most important one. It tells you whether a bad period is a type 1 mismatch (the system) or a type 2 mismatch (you). If the losing trades taken by the rules are within the normal range, and the losses come from trades outside the rules, you know exactly what to fix.
At the end of each year, run the trade by trade data through an AI tool or a simple spreadsheet and look for answers to specific questions: which markets and setups generate the profit, which only add noise, how your longest losing streak compares with the Monte Carlo expectation, and how much each deviation from the rules has cost you. AI is excellent at finding patterns in such a table, but only if the table exists.
5 mistakes that turn a normal drawdown into a disaster
- Judging the system on the last 10 to 20 trades. The sample is too small and the range of randomness is huge.
- Changing the rules in the middle of a drawdown. You adapt to the worst period and miss the recovery.
- Increasing risk to "win back" losses. During a losing streak, this accelerates the drawdown.
- Optimizing around one memorable trade. One trade is not statistics.
- Not keeping a journal. Without data you cannot tell bad luck from a bad system or poor discipline.
Where COT data helps
No tool eliminates losing streaks. That includes the COT Index. What COT analysis can do is improve your setup filter: trading more often in the direction Commercials are positioned and less often against crowded fund positions. That raises the expectancy per trade; it does not guarantee the next winner. If you want to see what such rules look like as a whole, take a look at our strategy and the open interest tool.
Frequently asked questions
How many losses in a row are normal for a system?
It depends on the win rate. With a 50% win rate and 200 trades, the longest streak is usually around 7, and in nearly a third of cases it is 8 or more. With a lower win rate, typical of trend following systems, streaks are even longer.
What is a Monte Carlo simulation in trading?
Repeatedly shuffling the order of trades (or generating new trades with the same statistics) to see the range of possible equity curves, drawdowns and periods without a new high, rather than just the average result.
When should I change my system's rules?
Rarely, and based on data. A good rule is a review roughly every 100 trades, with a change justified only if a drawdown or losing streak falls outside the Monte Carlo range, or if your journal shows a clear, recurring weakness.
Does win rate matter?
Not on its own. What matters is expectancy per trade, the combination of win rate and the ratio between average win and average loss. A system with a 40% win rate and an average win of 2.5R is far better than one with a 70% win rate and an average win of 0.3R.
What is a reasonable risk per trade?
For most individual traders, between 0.5% and 1% of equity. That way 10 consecutive losses, which will happen sooner or later, mean a drawdown of 5 to 10% rather than 20% or more.
Conclusion
The order of your trades is a factor you do not control. The same winning system can deliver an excellent year or a mediocre one purely because of the sequence in which wins and losses arrive. What you do control is your risk size, your discipline and the quality of the data you use to evaluate your system. Accept losing streaks as the price of an edge, not as proof that the edge has disappeared.
If you want to see how the big players are positioned before your next decision, start with the free COT Index demo. For full access to the tools and weekly analyses, see the membership plans.
Methodology: all figures in this article come from our own Monte Carlo simulations of a hypothetical system (100,000 sequences for losing windows, 20,000 for the longest streak, 10,000 for equity curves) and from exact binomial calculations. They are not results of actual trading. Futures trading involves substantial risk of loss. This content is for educational purposes only and is not investment advice.