Open interest in futures: how to read it
Open interest is one of the few numbers in futures that you cannot see on a price chart, and most traders read it from a table memorised from some book. In this article you will learn what open interest actually measures, why the classic rule "price up and open interest up means a strong trend" fails more often than people admit, and how to combine it with COT data to see who is really behind the change.
What is open interest in futures?
Open interest (OI) is the number of futures contracts that are open and have not yet been closed by an offsetting trade or by delivery. Every contract has two sides: one long and one short. So open interest is not "the number of buyers" but the number of buyer and seller pairs that still hold a position.
It is important not to confuse it with volume. Volume counts how many contracts changed hands during the day. Open interest shows how many contracts remain "alive" at the end of the day. There can be huge volume with almost unchanged open interest if participants are simply passing existing positions to each other.
Exchanges publish open interest every day, and the CFTC also includes it in the weekly COT report (as of Tuesday, published on Friday). The weekly version is the most useful, because it comes with a breakdown by participant group. On fmoney.eu you can follow it in the Open Interest tool.
How open interest changes
Open interest rises only when both sides of a trade open new positions. If one side closes an old position, the contract simply changes hands. If both sides close, open interest falls.
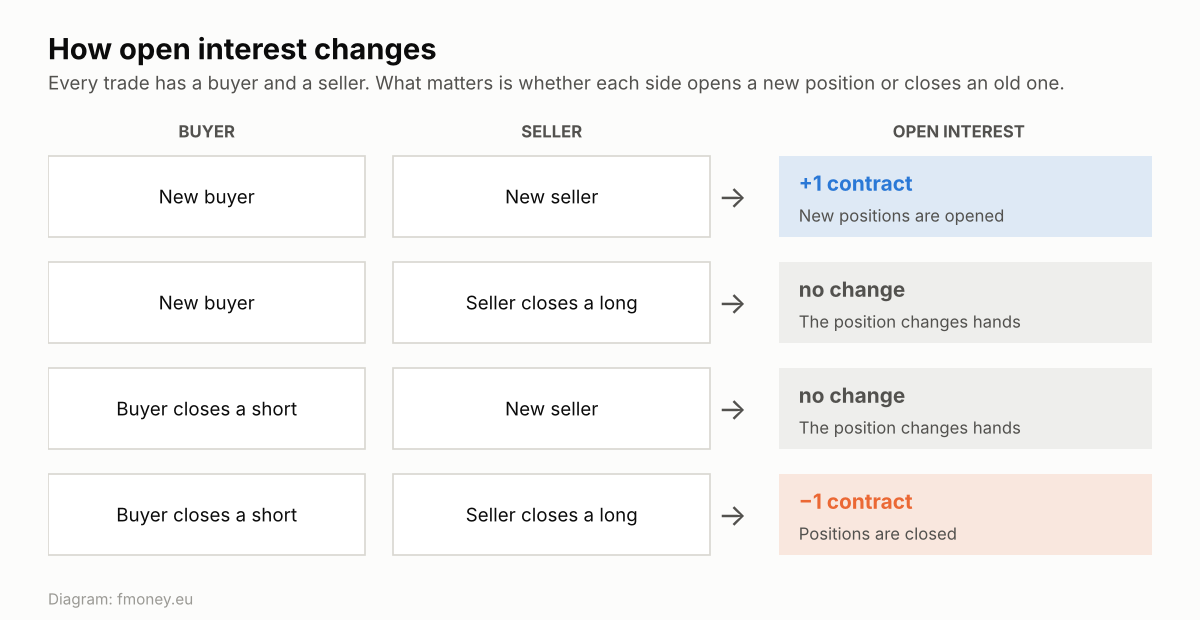
The most important point follows from this logic: a change in open interest tells you how much new money is entering or leaving the market, but not who is putting it in or in which direction. A rise of 50,000 contracts could be a fund buying or a producer hedging a future harvest. Price will react differently in the two cases.
The classic table: price and open interest
In almost every book on futures technical analysis you will find this table:
- Price up, OI up: new buyers are coming in, the trend is strong.
- Price up, OI down: short covering, the rally is weak.
- Price down, OI up: new sellers are coming in, the downtrend is strong.
- Price down, OI down: long liquidation, the decline is running out of steam.
It sounds logical. The question is whether it works. So we tested it.
We tested the rule on 16 years of data
We took weekly open interest from the CFTC COT reports for corn (CBOT) and gold (COMEX) from 2010 to 2026, and the front month price adjusted for contract roll jumps. We classified every week by the direction of price and open interest over the previous 4 weeks. Then we looked at what price did over the next 8 weeks and compared it with the baseline, meaning all weeks without a filter.
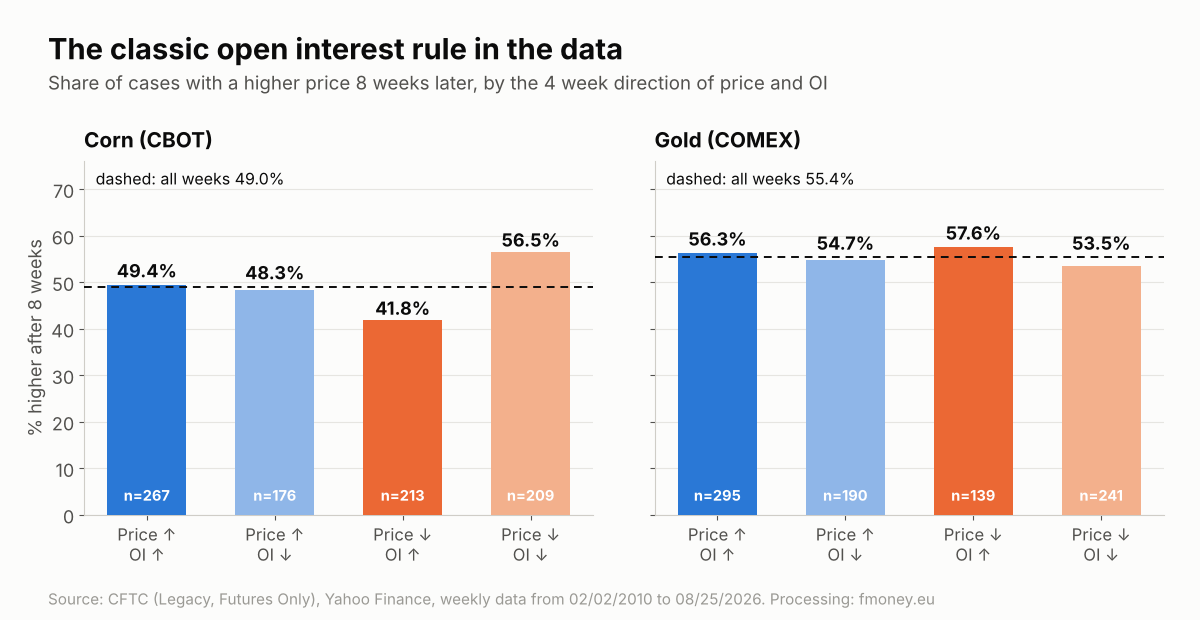
The result is sobering:
- Corn: the "strong uptrend" (price and OI up) produced a higher price after 8 weeks in 49.4% of cases, practically the same as the 49.0% baseline. The only clearer deviation is the "strong downtrend" (price down, OI up): only 41.8% higher. And "liquidation" (price and OI down) was followed by a rise in 56.5% of cases, which fits the idea of a decline running out of steam.
- Gold: all four groups are between 53.5% and 57.6% against a baseline of 55.4%. In other words, the table gives no edge.
A note for honesty: the windows overlap, and price is as of Tuesday while the report comes out on Friday. This is a descriptive test, not a ready made strategy. But the conclusion is clear: the direction of open interest alone is not an entry signal.
Why the rule fails: OI does not tell you who is coming in
The classic table silently assumes that new positions are opened by speculators chasing the trend. The data shows something else. In corn, the weekly change in open interest is most strongly linked to the long (correlation 0.74) and short (0.62) positions of Commercials, that is, the producers and processors who hedge. The long positions of Large Speculators come only after them at 0.47. In gold the picture is similar: Commercial shorts (0.71) and fund longs (0.67) drive open interest almost equally.
When a farmer sells futures to lock in the price of his crop, open interest rises. But this is not "a new seller who believes in a decline". It is a hedge that will be closed when the physical commodity is sold. That is why rising OI on a falling price is sometimes exactly the opposite of what the table promises.
Rule: the change in open interest is the question. The COT report is the answer. Always check which group opened or closed positions.
Open interest seasonality
Another trap: in agricultural markets open interest has its own seasonal rhythm, linked to hedging around planting and harvest. In corn it averages 6.2% above its annual average in February and 6.1% below it in September.
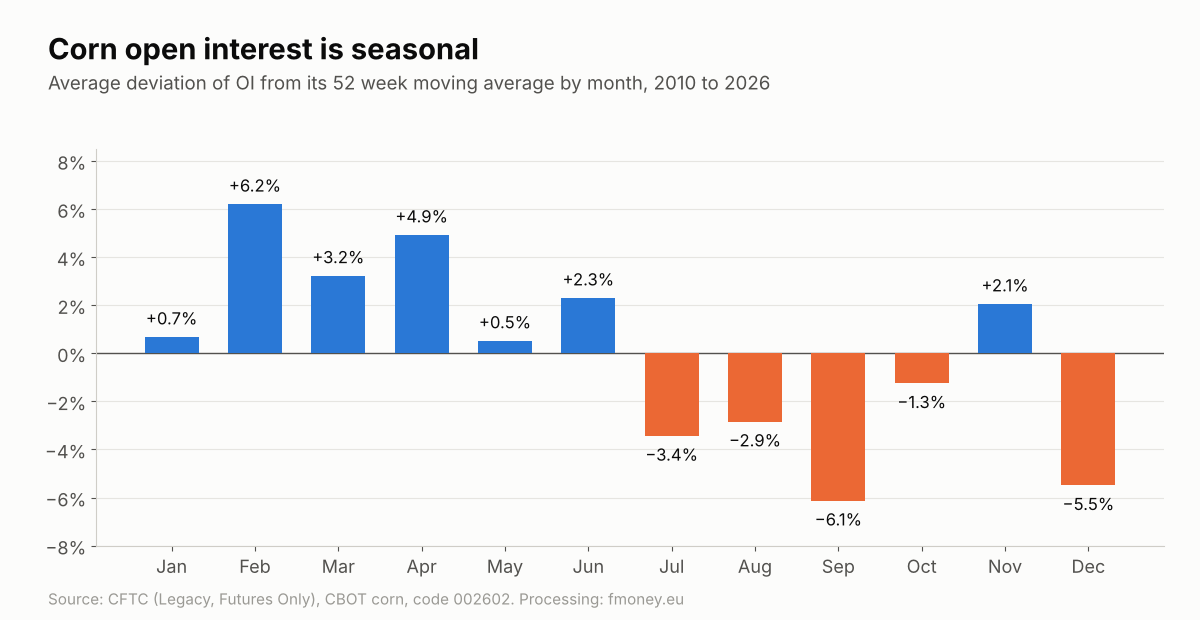
If you see open interest falling in September, it is often just the season and the expiry of the September and December contracts, not "the market losing interest". Compare open interest with the same period in previous years, not just with last week.
A live example: corn in October 2026
From 09/22 to 10/20/2026 the corn front contract fell from 536.75 to 462.00 cents per bushel, a drop of 13.9%. Open interest over the same period changed by only 1.0%: from 1,854,505 to 1,835,658 contracts. According to the classic table this is "long liquidation", a weak decline running out of steam. It looks calm.
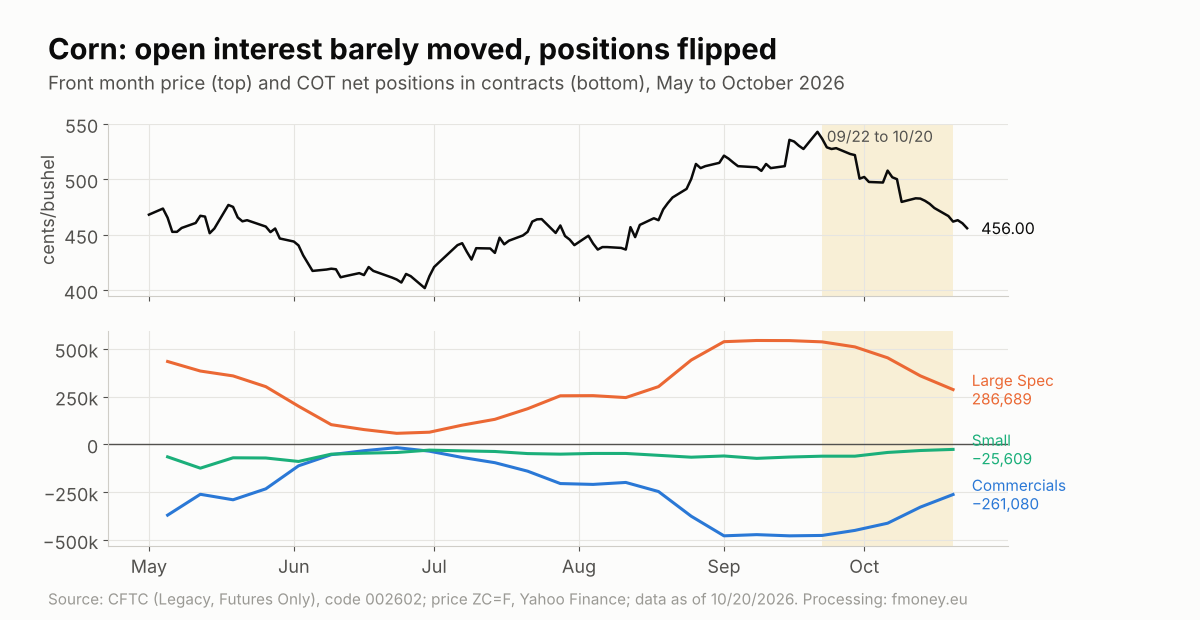
The COT report tells a completely different story. Over those four weeks Large Speculators closed 182,336 long contracts and opened 66,776 new shorts. Their net long shrank from 535,801 to 286,689 contracts. On the other side, Commercials added 88,978 long contracts and closed 124,753 shorts, and their net short fell from 474,811 to 261,080.
So there was no "calm liquidation". There was a mass exit by the funds, absorbed by hedgers buying at lower prices. Open interest barely moved because the funds' new shorts and the Commercials' new longs offset the closed positions. With open interest alone you would have missed the whole event.
Where are we now? The COT index (standard formula, 156 week window) as of 10/20/2026 is 68.3 for Large Speculators and 28.4 for Commercials. Neither group is in an extreme zone. In other words, positioning is no longer crowded, but it does not give a reversal signal either. This is information, not a recommendation.
5 mistakes when reading open interest
- Reading daily OI without context. Daily values jump around expiries and contract rolls. Look at weekly data and the trend over several weeks.
- Comparing only with last week. In agricultural markets, compare with the same season in previous years.
- Assuming new positions are speculative. A large part of open interest is hedges. Check in the COT report which group has grown.
- Using the table as an entry signal. As you saw, it gives no edge on its own. It is a question, not an answer.
- Ignoring very high levels. Corn open interest reached 2,071,614 contracts on 02/18/2025, the highest level in the data since 2010. Very high OI means more fuel for a sharp move when one side has to get out, but it does not tell you the direction.
A practical framework: open interest and COT together
Here is how we use open interest in our work:
- Change in OI: is there an unusually large rise or fall over the last 2 to 4 weeks, taking the season into account?
- Who is behind it: open the COT breakdown. Is it Commercials or Large Speculators? Are they opening or closing?
- Where positioning stands: check the COT index. A rise in OI driven by funds that are already in an extreme zone is a warning of a crowded trade.
- Does price confirm: COT shows where the pressure is, price tells you when. The entry comes from your strategy, not from a single indicator.
- Risk: before every trade, calculate your position size with the risk calculator.
Frequently asked questions
What is open interest in simple terms?
The number of futures contracts that are open and not yet closed. Every contract has one long and one short participant.
What is the difference between volume and open interest?
Volume counts the trades for the day. Open interest counts the positions that remain open at the end of the day. High volume with unchanged OI means positions are simply changing hands.
Is rising open interest bullish?
Not on its own. A rise means new money is coming in, but the direction depends on which group is opening positions. That is why you need the COT report.
Where can I get open interest data?
Exchanges (CME, ICE) publish daily data, and the CFTC publishes weekly data with a breakdown by participant in the COT report. On fmoney.eu you will find it processed in the Open Interest tool.
Why does open interest fall before expiry?
Because most participants do not want delivery and close their positions or roll them to the next contract. That is why around expiries you should compare total OI across all contracts, not just the front month.
Conclusion
Open interest is useful, but only as a question: "Something is changing in positioning, who is behind it?". The classic price and OI table does not pass a test on the data, especially in gold. The real value comes when you link open interest to the COT report and see whether hedgers or funds are opening and closing positions. The corn example from October 2026 shows how much can hide behind almost motionless open interest.
If you want to see this data every week without manual processing, start with the free COT index demo; full access to the tools is in the membership plans.
Futures trading carries a high level of risk and is not suitable for everyone. The content is for educational purposes and is not investment advice. Historical results do not guarantee future results. Data: CFTC (Legacy, Futures Only), Yahoo Finance, as of October 20, 2026.