Lean Hogs and the COT index: what 26 years of data show
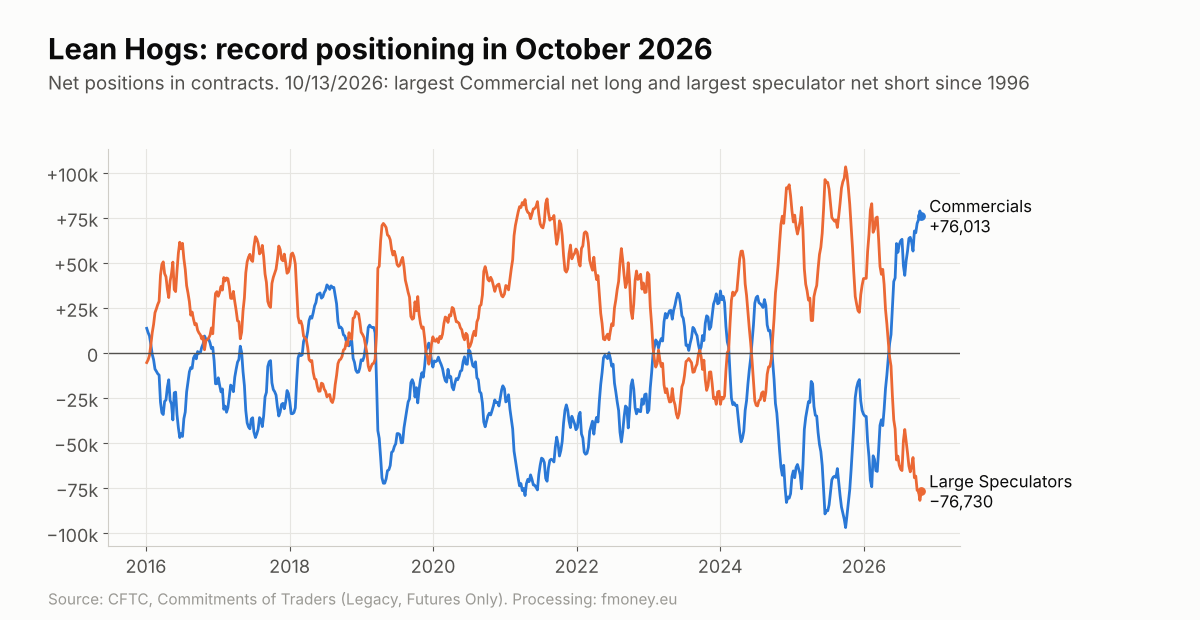
On October 13, 2026, Commercials in Lean Hogs held the largest net long position in the history of the contract since 1996. In the same week Large Speculators had a record net short. It looks like a textbook bottom signal. But is it? Instead of guessing, we tested every similar extreme of the last 26 years and what price did afterwards. The answer is more interesting than most COT "gurus" would admit.
What is the Lean Hogs market?
Lean Hogs (CME, symbol HE) is the futures contract on US pork. It trades in cents per pound, and there are eight contract months a year: February, April, May, June, July, August, October and December. Settlement is in cash against the CME Lean Hog Index, not by physical delivery.
Who stands behind the groups in the COT report:
- Commercials: meat packers, farms, merchants. Packers buy futures to lock in the price of their raw material. Farmers sell to insure the price of their animals.
- Large Speculators: funds and CTAs that trade the trend.
- Small Traders: small participants below the reporting threshold.
Hogs also have three features that make analysis harder than in gold or corn: strong seasonality, large price differences between individual contracts, and a relatively small market, with about 290 thousand open contracts as of 10/20/2026.
Where we are now: record positioning
Here is the CFTC data (Legacy, Futures Only) as of Tuesday, October 20, 2026:
- Commercials are net long 76,013 contracts. Their COT index (3 years) is 98.4. A week earlier, on 10/13, their net long was 78,874 contracts. That is the highest net long since the contract began in 1996.
- Large Speculators are net short 76,730 contracts, COT index 2.7. On 10/13 their net short reached a record 81,787 contracts.
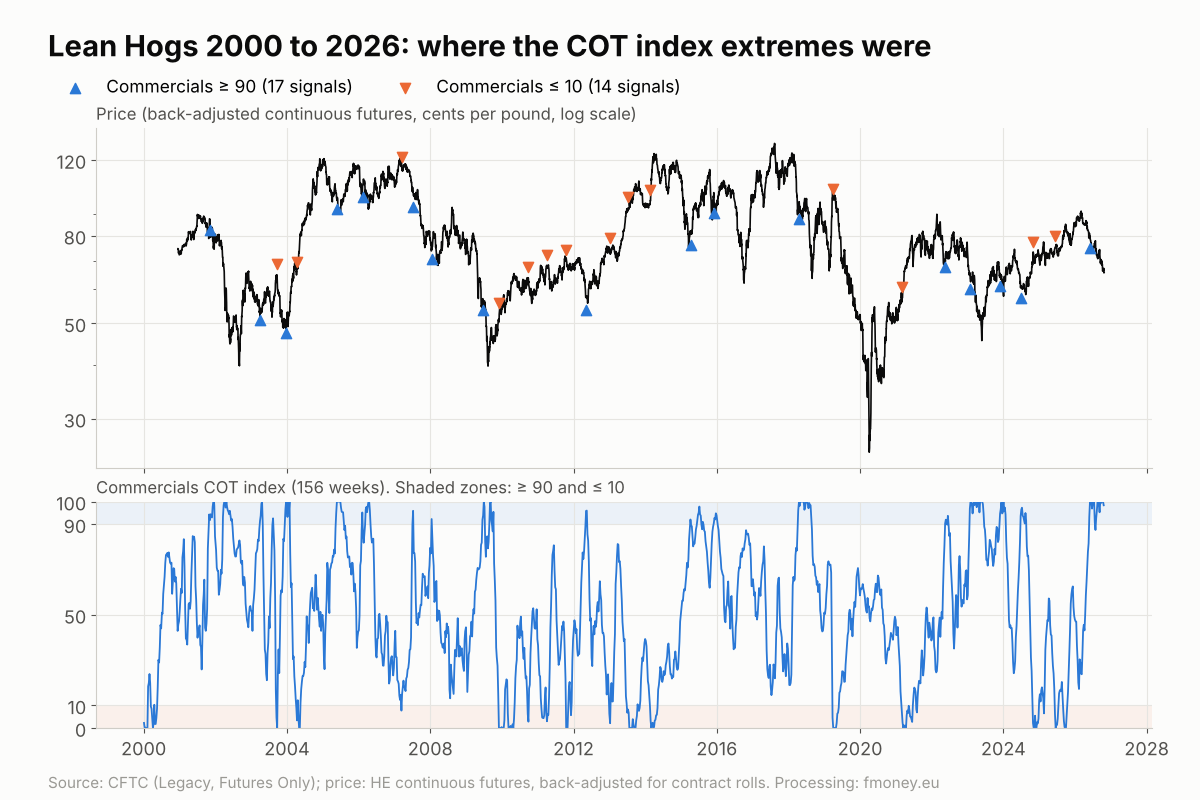
- The Commercials' COT index has now been above 90 for 12 consecutive weeks.
And here is the first lesson. Commercials entered the extreme zone back at the end of May 2026. From the Friday after that signal (05/29) to 10/23, the price adjusted for contract rolls has fallen by about 17.6%. Not only did the extreme fail to turn the market, it deepened.
Historical backtest: how price reacted
To answer whether an extreme COT index works in hogs, we checked every case from December 2000 to October 2026.
Methodology: Commercials' COT index with a 156 week window. A signal is the first week the index enters the zone ≥ 90 (bullish) or ≤ 10 (bearish), with at least 26 weeks between two signals of the same type. Entry is the close on the Friday the report is published, using only information that was actually available. The result is the price change after 4, 8, 13 and 26 weeks, compared with all weeks in the period (the baseline).
The results
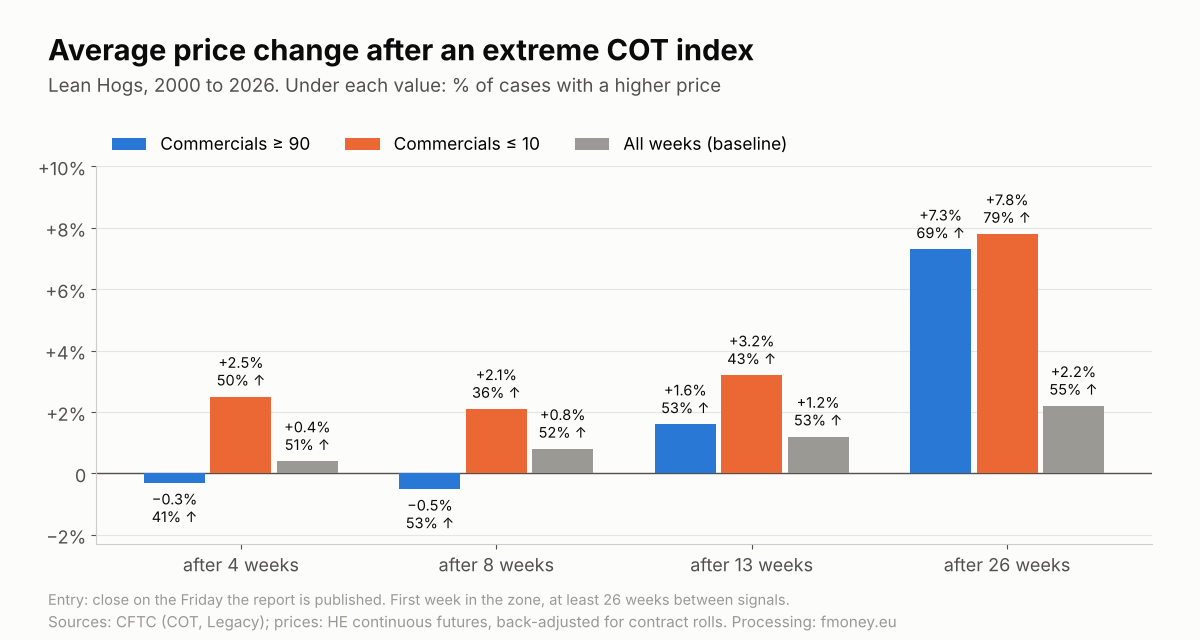
Commercials ≥ 90 (bullish signal, 17 cases). In the first 4 to 8 weeks there is no edge at all. After 4 weeks price is on average −0.3%, and it rose in only 41% of cases, less often than in an average week. The tilt appears later: after 26 weeks the average is +7.3% against a baseline of +2.2%, with price higher in 69% of cases.
Commercials ≤ 10 (bearish signal, 14 cases). Here the theory fails completely. If extremely short Commercials foreshadowed a decline, price should have fallen. Instead the average change is positive at every horizon: +2.5% after 4 weeks and +7.8% after 26 weeks. After 8 weeks price is lower in 64% of cases, but on average it is still higher, because a few strong rallies (2004, 2021) skew the average.
Each signal on its own
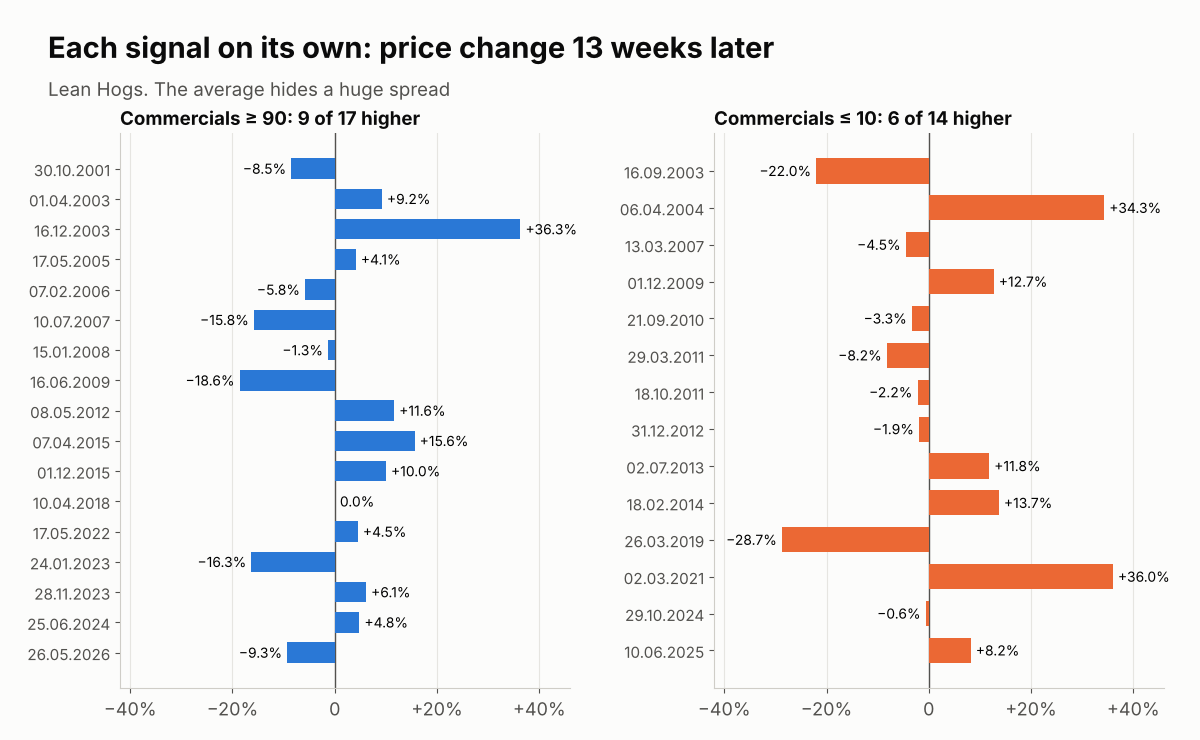
The averages hide a huge spread. After the bullish signal on 12/16/2003, price rose 36.3% in 13 weeks. After the bullish signal on 06/16/2009, it fell 18.6%. The bearish signal of 03/26/2019 was followed by a 28.7% decline, and the bearish signal of 03/02/2021 by a 36% rise. With 14 to 17 cases per side, one or two trades decide the average. This is a small sample and should be read as a tilt, not a rule.
Entering the extreme versus leaving it
We also tested another variant: a signal not when the index enters above 90 but when it drops back below 90, that is, when Commercials start reducing their extreme long. With the same 17 signals the short term result is better: +3.7% after 4 weeks and +6.2% after 8 weeks, with price higher in 65% of cases. The logic is simple: the extreme shows where risk has built up, while the change in direction shows when the balance starts to turn. That is exactly the idea behind our COT Speed Index, which measures the speed of change in Commercial positions.
The chart trap: contract rolls
If you open the continuous hog chart (HE1!) on most platforms, you will see huge "crashes" and "rallies" in the middle of the month. Many of them are not real. When the front contract rolls, the price jumps by the difference between the old and the new contract. On 08/15/2023 the continuous chart shows a 23.5% drop in a single day. In reality it is simply the roll from the August to the October contract.
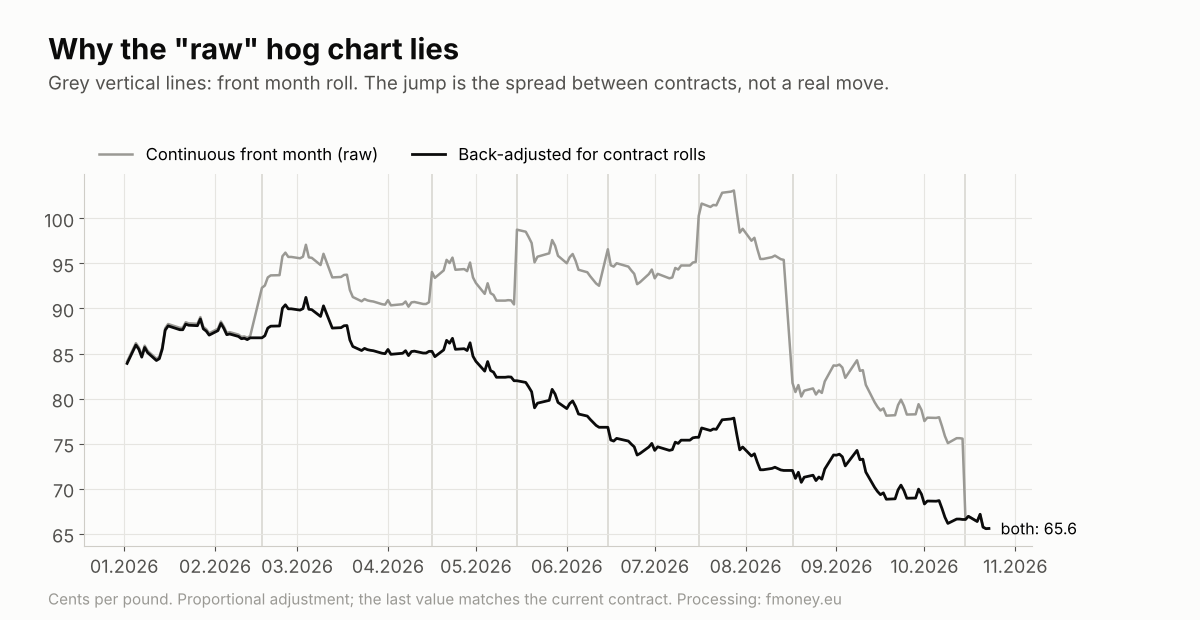
That is why all calculations in this article use a price adjusted for contract rolls. Without that adjustment the "backtest" would mostly measure the spreads between contracts, not the market's reaction. It is also the most common reason why COT tests for hogs on the internet give the wrong results.
5 mistakes in COT analysis of Lean Hogs
- Treating the extreme as an entry signal. In 2026 Commercials have been in the extreme zone since the end of May, and price has fallen by about 17.6%. An extreme can last for months.
- Expecting symmetry. In hogs the bullish side (Commercials ≥ 90) shows a moderate long term tilt. The bearish side (Commercials ≤ 10) has historically not predicted declines.
- Looking at a raw continuous chart. Roll jumps exceed 20%. Analyse the specific contract or an adjusted series.
- Ignoring seasonality. Hogs have a strong annual supply and demand cycle. A COT signal against seasonality has lower odds.
- Trusting the average. With 14 to 17 cases, one trade of +36% or −29% changes the whole picture. Look at the distribution and the win rate, not just the average.
How to use COT in Lean Hogs
- The extreme is a filter, not a signal. Commercials ≥ 90 means: look for a long opportunity, do not open a short against them.
- Wait for positions to turn. Leaving the zone, or a sharp change in the pace of accumulation, is a better moment than the entry into the extreme itself.
- Confirmation from the chart and seasonality. A breakout, a reversal pattern and a supportive seasonal window in the specific contract.
- Risk first. Hogs are volatile and have daily limits. Set your stop and position size in advance, for example with our risk calculator.
That is how our strategy is built: COT sets the direction, technical analysis sets the timing.
Frequently asked questions
What does the COT index show in Lean Hogs?
Where a group's net position sits relative to its minimum and maximum over the last 3 years, on a scale of 0 to 100. A value of 98.4 for Commercials (as of 10/20/2026) means they are almost as long as their maximum for the period.
Is the record Commercial net long a buy signal?
Not on its own. Historically, after such extremes price has a moderate positive tilt over 26 weeks, but there is no edge in the first 4 to 8 weeks. In 2026 the extreme has lasted since the end of May, and price has fallen.
Why does the bearish signal not work in hogs?
In the 14 cases with Commercials ≤ 10, price rose on average instead of falling. Possible reasons are the small sample, strong seasonality and the structure of the market. The takeaway is that the method has to be tested market by market.
When is COT data for Lean Hogs published?
Every Friday at 3:30 pm New York time, with positions as of Tuesday of the same week.
Why does the continuous hog chart have such big jumps?
Because of the front contract roll. Different contract months trade at very different prices, so the chart "jumps" at every transition. For analysis, use an adjusted series or the specific contract.
Conclusion
Lean Hogs are a good example of why COT analysis is not the Holy Grail. The record positioning of October 2026 is important information because it shows where risk has built up. But 26 years of history say clearly: in this market the extreme alone is not enough. The bullish side gives a moderate long term tilt, the bearish side almost nothing, and the timing of the entry decides everything.
If you want to follow the COT index, COT Spread and COT Speed Index for Lean Hogs and all major futures markets, take a look at the free demo. Full access, the weekly analyses and the strategy rules are in the membership plans.
Futures trading carries a high level of risk and is not suitable for every investor. The content is for educational purposes and does not constitute investment advice. Past results do not guarantee future results. Data: CFTC, Commitments of Traders (Legacy, Futures Only), as of October 20, 2026; prices: Lean Hogs continuous futures (CME), adjusted for contract rolls, as of October 23, 2026.