FUTURES BRIEF: Saturday, October 24, 2026
The week in futures markets ended with oil above 100 dollars a barrel, a fourth straight losing week for corn and the first signs of a bottom in soybeans. In this FUTURES BRIEF we collect Friday's prices from October 23, 2026, and check them against the positioning of hedgers and funds in the COT report as of Tuesday, October 20, 2026.
In brief: five things from the week
- Oil leads everything. December WTI settled on Friday at 103.60 dollars (up 4.13 dollars), while Brent traded around 116 to 117 dollars. The driver is fear of new strikes between the US and Iran and threats around the Strait of Hormuz. Oil is up for a third straight week, gaining about 5% on the week.
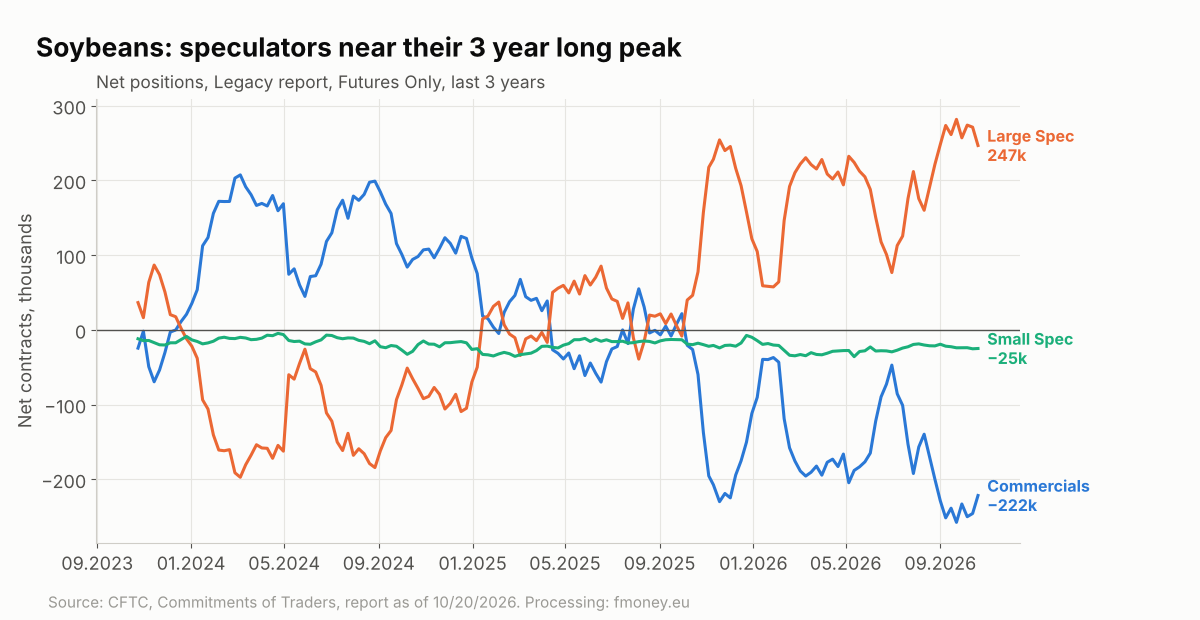
- Soybeans look for a bottom. November soybeans settled at 12.565 dollars (up 3.5 cents), supported by oil and almost daily sales to China. But funds are near their three year high in longs, and hedgers are heavily short.
- Corn is under harvest pressure. December corn settled at 4.56 dollars, the lowest close since July 10, with a fourth straight week down (minus 18.5 cents on the week).
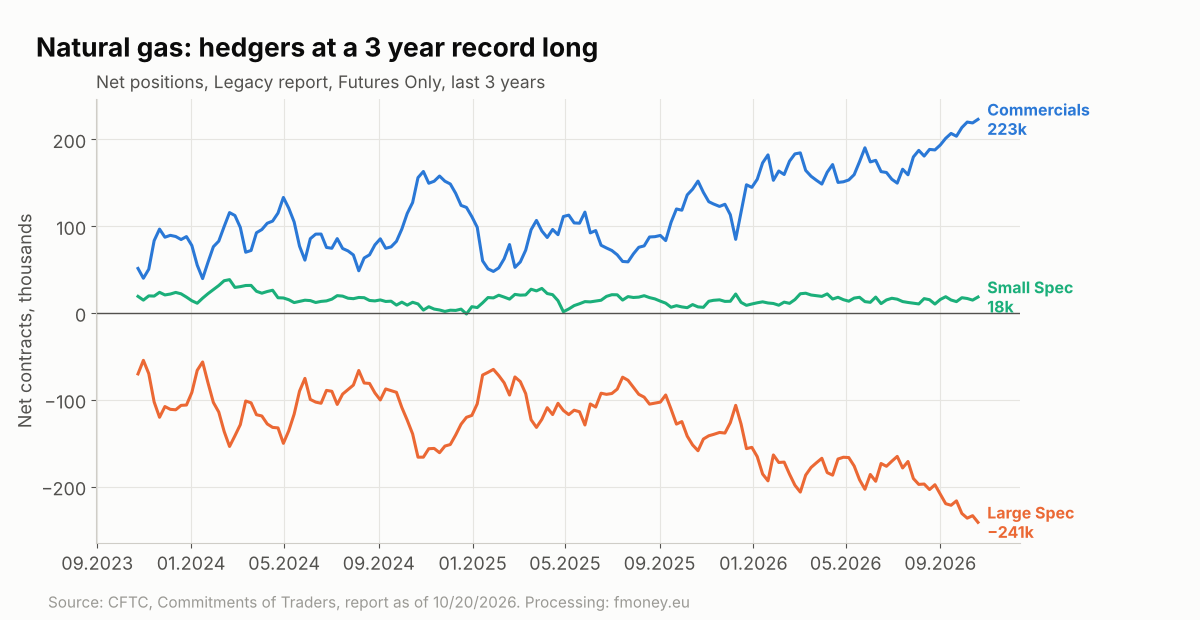
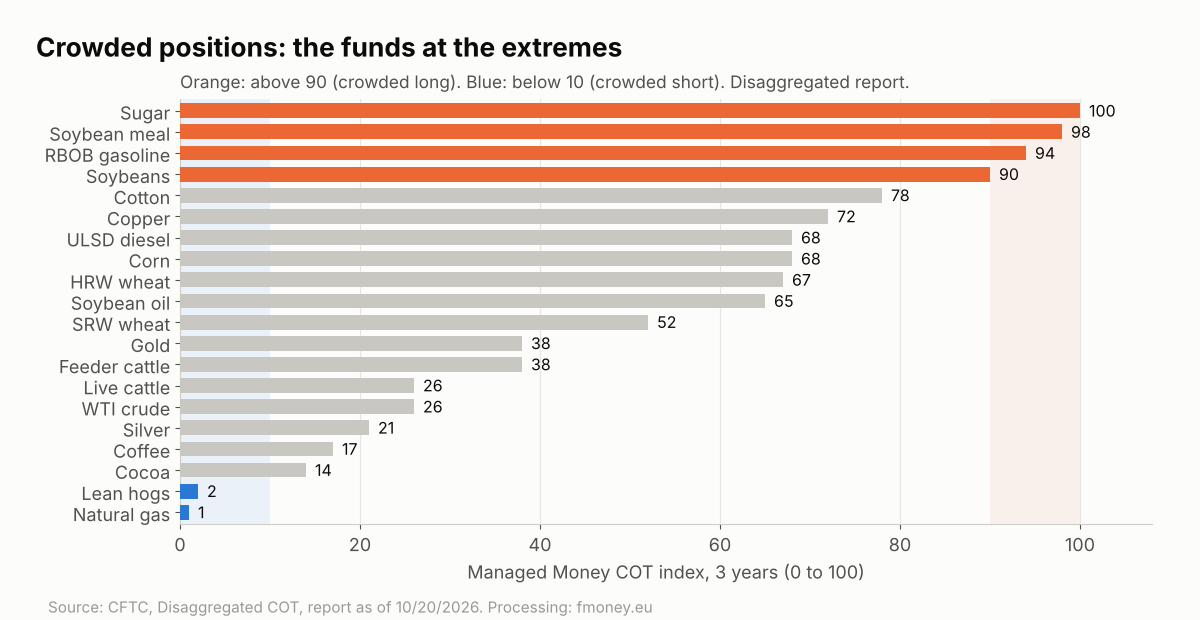
- Natural gas has the most extreme positioning on the board. Commercials are at 100 on the 3 year COT index (their longest position for the period), while Managed Money is at 1.2. This is a classic crowded short.
- Sugar is the mirror image. Funds are at 100 on their COT index (crowded long), while hedgers are at 0.1. The price reaction to strong oil was modest.
How we read the board: the Commercial filter
Before we look at the groups, a reminder about the method. We do not look at price on its own. We open a position only if the hedgers (Commercials) are in sync with the direction: a long position only with net long Commercials, a short only with net short ones. The chart below shows where the hedgers are in each market relative to the last 3 years.
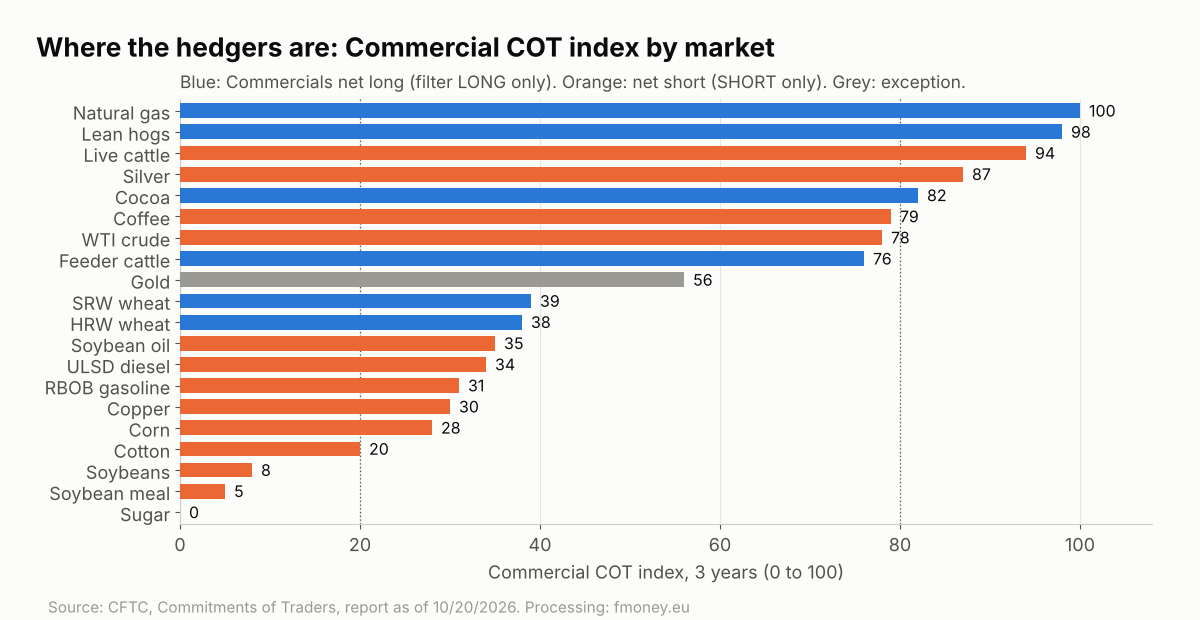
COT index = (current net position minus the period minimum) / (maximum minus minimum) × 100. A value near 100 means the group is at its longest for the period; near 0 means its shortest.
The full interactive version for all markets is in the COT index demo.
Grains and oilseeds
Theme of the week: the harvest weighs on corn, while soybeans lean on oil and China.
Corn. The December contract settled at 4.56 dollars a bushel (down 4.5 cents) and March at 4.7025 dollars. Favourable weather in the Corn Belt is speeding up the harvest, and funds are liquidating longs. A flash sale of 116,000 tonnes to an unknown destination was announced.
→ COT (10/20): Commercials net short 261,080 contracts (covered 65,878 on the week), index 47 / 40 / 28 for 6 months, 1 year and 3 years, filter SHORT only. Managed Money net long 164,423, but cut 82,002 contracts in a week. The fund selling is real, and hedgers are covering their shorts. This is a typical sign that harvest pressure is running out, but the filter does not yet allow a long position.
Soybeans. November soybeans settled at 12.565 dollars (up 3.5 cents), March at 12.76 dollars. Weekly export sales reached 104 million bushels, the highest in almost 3 years, with flash sales to China almost every day. Support is also coming from oil through biodiesel: soybean oil settled at 66.83 cents (up 0.09) and meal at 346.10 dollars (down 1.20 dollars). In Brazil planting is ahead of schedule, which remains the risk for the coming months.
→ COT (10/20): Commercials net short 221,638 (covered 24,101), index 17 / 16 / 8, SHORT only. Managed Money net long 221,325 (minus 28,482), 3 year index 90, z52 0.88. Soybean meal is even more extreme: Managed Money at 98 on the 3 year index, Commercials at 5.
Wheat. December Chicago wheat settled at 6.25 dollars (up 0.25 cents), Kansas City at 6.645 dollars (down 1.25 cents). All classes are technically heavily oversold. The market is watching the Black Sea peace talks, provisionally scheduled for November 10. The chance of peace is weighing on prices.
→ COT (10/20): SRW Commercials net long 29,782 (up 14,906), index 65 / 47 / 39, LONG only. Managed Money net short 52,005 (added 19,450). HRW Commercials net long 1,191, LONG only. Wheat is the only grain market where the filter allows the long side.
Energy
Crude oil. December WTI settled at 103.60 dollars (up 4.13 dollars) according to Brownfield. Total Farm Marketing gives 103.45 dollars (up 3.97); the difference comes from the time of the quote. Brent moved around 116 to 117 dollars. The driver is geopolitical: expectations of renewed US strikes on Iran and tension around Hormuz and Bab el Mandeb.
→ COT (10/20): Commercials net short 116,158 (covered 9,177), index 77 / 75 / 78, SHORT only. Managed Money net long only 36,187, 3 year index 26. What is interesting here is that with price above 100 dollars, the funds are not crowded long. The rally is driven by news, not by speculative excess. RBOB gasoline is different: Managed Money at 94 on the 3 year index.
Natural gas. Henry Hub traded around 3.09 dollars per MMBtu on Friday, down about 0.7% on the week (one source, not confirmed by CME). Gas did not follow oil.
→ COT (10/20): Commercials net long 222,969 (up 4,131), index 100 / 100 / 100, LONG only. Managed Money net short 157,409, adding another 30,928 shorts, 3 year index 1.2, z52 minus 2.12. This is the most extreme picture on the board this week.
Metals
December gold settled at 4,013.40 dollars (down 47 dollars, about 1.2%). Silver was around 53.96 dollars (about 1.9% lower), copper around 6.50 dollars (about 1.6% higher according to Yahoo Finance, from a lower level in the morning). The silver and copper levels are approximate and taken at different times. The pressure on precious metals comes from yields: 10 year US Treasuries reached about 5.00%.
→ COT (10/20): Gold, Commercials net short 235,582, index 47 / 55 / 56; gold is a documented exception, and the filter is only a guide. Silver, Commercials net short 37,176, but index 100 / 100 / 87, meaning hedgers are the least short in a year, while Managed Money has a 3 year index of 21 and z52 of minus 1.81. Copper, Commercials index 100 for 6 months and 30 for 3 years, SHORT only. In metals the Commercial filter is especially valuable because speculators often overheat.
Softs
Sugar. Around 20.2 cents per pound, slightly higher on Friday. The trend in New York and London remains down, although Brazilian mills prefer ethanol to sugar. → COT: Managed Money net long 264,530, 3 year index 100, z52 2.16. Commercials index 0.1, SHORT only.
Coffee. Arabica is around 306 cents (down about 2% on Friday) but about 11% higher on the month. Brazilian producers are holding back sales. → COT: Commercials net short 21,763, index 43 / 61 / 79, SHORT only.
Cocoa. New York around 5,580 to 5,590 dollars a tonne, the lowest since early October. Arrivals at Côte d'Ivoire ports are 52% lower than last year, and dry weather is raising concerns about the next crop. → COT: Commercials net long 5,363, index 32 / 41 / 82, LONG only.
Cotton. December settled at 80.20 cents (down 59 points). Only 35% of the US crop is in good to excellent condition, and the harvest is 41% complete. → COT: Commercials 3 year index 20, SHORT only.
Livestock
December live cattle settled unchanged at 231.12 cents, November feeder cattle at 348.12 (up 1.20). December hogs settled at 65.57 (up 0.02 cents), after the market made new contract lows on Thursday amid the seasonal decline in demand. The Cattle on Feed report was on Friday; according to the first headlines placements were about 12% lower year on year, but we have not checked the full data.
→ COT (10/20): Live cattle, Commercials net short 22,995, index 95 / 95 / 94, SHORT only; hedgers are close to their least short position in 3 years. Hogs, Commercials net long 76,013, index 97 / 98 / 98, LONG only; Managed Money net short 46,813, 3 year index 2. In hogs and gas we see the same setup: hedgers at a maximum long, funds at a maximum short.
Stock indices
Cash indices on Friday: Dow Jones 52,215.16 (down 652.82 points, 1.23%), S&P 500 7,623.68 (down 0.52%), Nasdaq Composite 25,955.34 (down 0.21%). On Thursday the Nasdaq lost 2.6% in a tech sell off. The S&P 500 and Nasdaq posted a second straight losing week, while the Dow ended the week higher. The drivers are oil above 100 dollars, yields around 5.00% and the VIX around 19 to 19.5 (sources differ by half a point).
→ COT (10/20): ES, Non Commercials net short 142,671, Leveraged Funds (TFF) net short 371,245, Asset Managers net long 901,377. NQ, Non Commercials net long 50,726 with a 3 year index of 92 (crowded), Leveraged Funds almost neutral (950). RTY, Leveraged Funds net short 53,035, having covered about 38,600 on the week. Stock indices are a documented exception to the Commercial filter.
News failure
This module looks for markets where speculators are at an extreme (COT index above 90 or below 10 for Managed Money or Non Commercials) and checks whether important news in the direction of the crowd was met with the opposite price reaction. Such a "failure" is often the first sign that the fuel for the move has run out.
| Market | Crowd | News | Reaction | Classification |
|---|---|---|---|---|
| Soybeans | Long (MM 90) | Record sales for 3 years, oil higher | Up 3.5 cents | Weak confirmation |
| Sugar | Long (MM 100) | Oil up 4%, ethanol gains | About up 0.5%, trend down | Watch |
| Natural gas | Short (MM 1) | No key news for gas | About down 0.7% on the week | No failure |
| Hogs | Short (MM 2) | New contract lows, seasonal decline | Up 0.02 on Friday | Watch |
| Nasdaq (NQ) | Long (Non Comm 92) | We found no confirmed reason for Thursday's drop | Down 2.6% on Thursday | Cannot be classified |
Result: no confirmed news failure this week.
My interpretation (medium confidence): sugar is closest to a signal. Funds are at an absolute maximum long, and a strong bullish impulse from oil produced only a token gain in a downtrend. If the next bullish news also fails to lift price, the picture will become a classic failure. The alternative reading is that sugar is simply lagging the energy complex and will catch up. In hogs, a new contract low that the market cannot hold would be an early sign of seller exhaustion; for now it is only something to watch.
What we are watching in the new week
- Oil above 100 dollars and whether the rally spreads to soybean oil and sugar.
- Soybeans: do flash sales to China continue? The risk is the crowded fund long against short hedgers.
- Wheat: the Black Sea peace talks scheduled for November 10.
- Natural gas and hogs: whether the crowded short starts to be covered.
- The next COT report comes out on Friday, October 30, 2026, with data as of Tuesday, October 27.
Every setup in this brief is a candidate, not a ready recommendation. Position size and stop depend on personal risk; you can calculate them with the risk calculator. How we combine the COT filter with the technical entry is described in our strategy, and we track changes in open interest in the Open Interest section.
Frequently asked questions
What is the FUTURES BRIEF?
A weekly fmoney.eu overview of the main futures groups: grains, energy, metals, softs, livestock and stock indices. Each group is compared with actual positioning from the CFTC's COT report.
Why is COT data as of Tuesday while prices are as of Friday?
The CFTC publishes the report on Friday, but it reflects positions as of Tuesday of the same week. That is why we always state the date of the data.
What does "LONG only" or "SHORT only" mean?
This is the Commercial filter. If hedgers are net long, we look only for long positions; if they are net short, only for short ones. Gold and stock indices are exceptions.
What is a crowded position?
When funds are in the top or bottom 10% of their 3 year range. At that point new buyers or sellers run out and the market becomes vulnerable to a move in the opposite direction.
Conclusion
The week belongs to oil, but the most interesting COT pictures are elsewhere: natural gas and hogs with hedgers at a maximum long and funds at a maximum short, and sugar and soybean meal at the opposite extreme. The filter says clearly which direction to look in, and price will show when. If you want to see this data every week for more than 30 markets, take a look at the fmoney.eu membership plans.
Sources: CFTC (Legacy, Disaggregated and TFF reports as of 10/20/2026), Brownfield Ag News, Total Farm Marketing, CNBC, Yahoo Finance, Trading Economics, DTN, ThePigSite. Prices are as of the close on 10/23/2026, and some are approximate where sources differ. Futures trading carries a high level of risk and is not suitable for everyone. This material is educational and is not investment advice.