Why Gold Crashed to Its Lowest Price in a Year
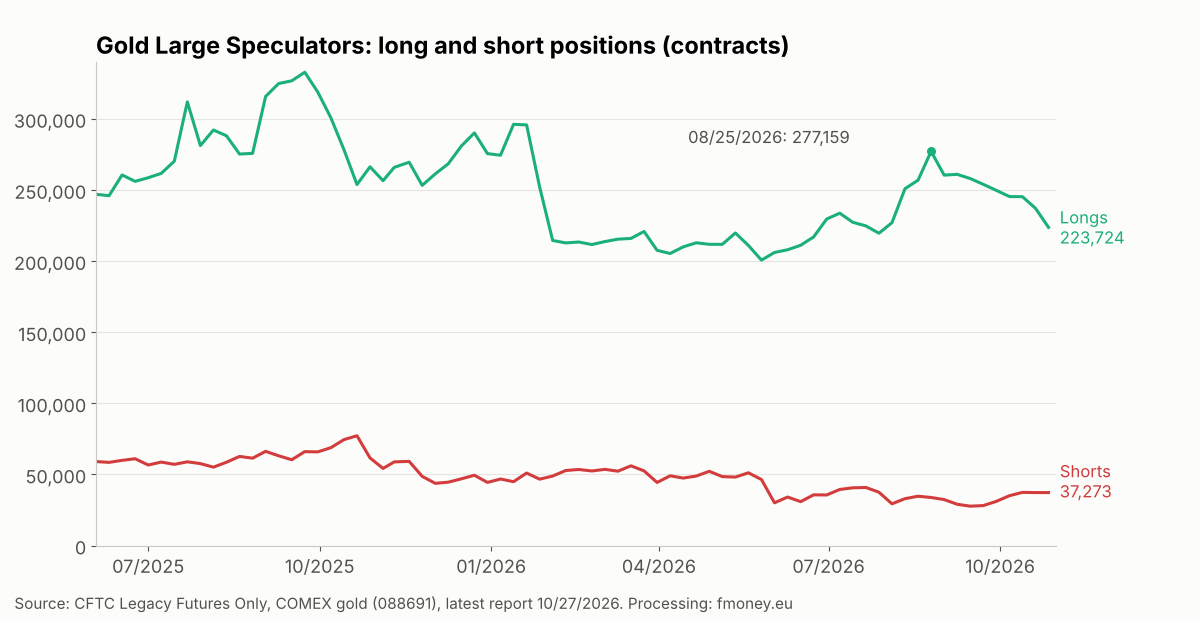
Gold fell to its lowest price in a year because the market started pricing higher interest rates for longer: expensive oil pushed inflation up, the Fed is keeping the door open to another hike in December, and the sell-off in technology stocks forced some investors to sell gold to cover their losses. COT data show that large speculators had been cutting their long positions for two full months before the crash.
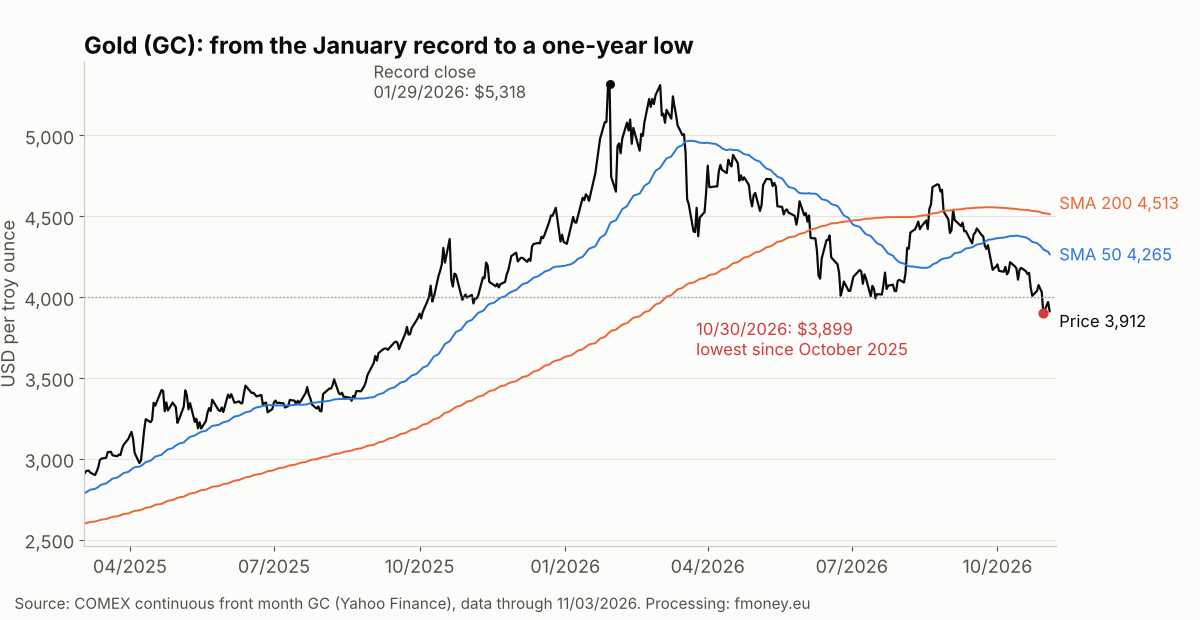
- October 30, 2026: gold futures (GC, COMEX) settled at $3,899 per troy ounce, down 3.3% on the day, with a session low of $3,879.
- Lowest since October 2025: the last close below this level was on October 2, 2025.
- From the peak: the record close was $5,318 on January 29, 2026, a decline of 26.7%.
- October 2026: down 6.9% for the month, the weakest October in our data going back to 2010.
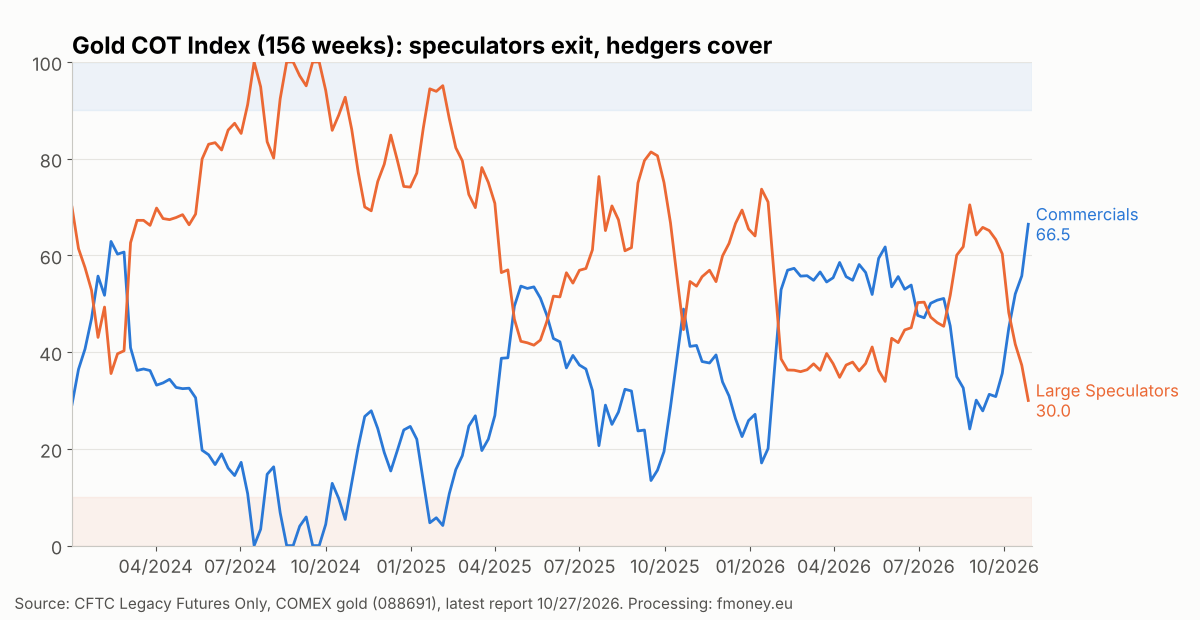
- COT as of October 27, 2026: the Commercials COT Index rose to 66.5, while the Large Speculators index fell to 30.0.
What happened on Friday, October 30
The week opened with attempts to hold $4,000, a level gold had broken for the first time since July a week earlier. On Wednesday the Fed left rates unchanged, on Thursday strong inflation data came out, and on Friday selling intensified and gold dropped more than 3% in a single day. Silver fell below $50 for the first time since November 2025, and gold mining stocks fell harder than the metal itself.
The key point is that there was not one cause but several, all landing in the same week. Here they are in order.
Five reasons gold crashed
1. The Fed is talking about hikes, not cuts
On October 28, 2026 the Fed kept its policy rate in the 3.75% to 4% range after raising it in September. The vote was 10 to 2, with Lisa Cook and Beth Hammack voting for another hike. Chair Kevin Warsh named bringing inflation back to 2% as the overriding priority and did nothing to push back on market expectations of a December hike. Gold pays no yield, so every rise in Treasury yields increases the cost of holding it.
2. Oil is keeping inflation high
Fears over Middle East supply keep oil expensive, and expensive energy feeds into the price of everything else. The September PCE price index rose 0.5% on the month and 3.6% year on year, and third quarter growth beat expectations. Commerzbank analysts argue that gold's link to oil and to Fed expectations will keep it under pressure until the Strait of Hormuz reopens.
3. Margin calls from the tech stock sell-off
Technology stocks also dropped sharply on Friday. According to Commerzbank, this likely triggered forced selling: investors hit with margin calls on equities sell whatever is liquid and still in profit. Gold, after a steep two year rally, is exactly that kind of asset. On days like this gold does not act as a safe haven; it acts as a source of cash.
4. ETF outflows and weak physical demand
North American investors are exiting gold-backed funds while Asian investors buy, but not enough to absorb the selling. Physical demand in India and China remains soft, with Indian buyers holding off in anticipation of even lower prices.
5. A technical break below $4,000
The market tested $4,000 several times in October. When the July support near $3,975 gave way on Friday, stop orders on long positions accelerated the decline. Price is now well below the 200 day moving average, which sits near $4,513.
What the CFTC COT report shows
The news explains why gold fell on Friday. The COT data show who was selling before that. The latest report reflects positions as of Tuesday, October 27, 2026, three days before the crash, and the picture is still clear.
- Large Speculators cut their net long position from 243,334 contracts (August 25, 2026) to 186,451 contracts (October 27, 2026), a reduction of 56,883 contracts in two months.
- This is mainly long liquidation, not aggressive new shorting: longs fell from 277,159 to 223,724 contracts, while shorts rose only from 33,825 to 37,273.
- Commercials (producers, refiners, dealer banks) reduced their net short position, and their COT Index jumped from 24.1 to 66.5. Hedgers are covering shorts as price falls.
- Open interest shrank from 427,957 to 396,810 contracts. Falling price with falling open interest means the market is being cleared of longs, not filling up with new sellers.
Important: a Commercials COT Index of 66.5 is not yet an extreme. In our method, a hedger buy signal is above 90. Positioning is moving in the right direction for buyers, but it is not there yet.
What happened after the two previous liquidations
Over the past year there were two other episodes in which speculators sharply cut their net long positions. The outcomes were opposite, so we show them as they are:
| Episode | Large Speculators net position | After 4 weeks | After 8 weeks | After 13 weeks |
|---|---|---|---|---|
| October 2025 | from 266,749 (09/23) to 176,609 (10/21) | −1.4% | +6.0% | +20.3% |
| February 2026 | from 244,770 (01/20) to 160,012 (02/10) | +0.3% | −5.1% | −9.6% |
Returns are measured from the Friday close after the last report of each liquidation. Two cases are not statistics. The takeaway is different: the liquidation by itself is not a buy signal. In October 2025 it cleared the market ahead of the next rally; in February 2026 it was only the start of a longer correction. What mattered was whether the macro reason for the selling went away.
Seasonality for November and December
Over the last 10 years (2016 to 2025), November has been a neutral month for gold: an average of −0.4%, higher in 5 of 10 years. December is stronger: an average of +2.7%, higher in 8 of 10 years. Seasonality is background, not a reason to trade.
What comes next: levels and events to watch
- $3,886: the support Standard Chartered calls critical. A sustained break below it could open a deeper correction.
- $3,800: the next target for analysts who see the path of least resistance still pointing lower.
- $4,000 and the 50 day SMA (near 4,265): the levels price needs to reclaim before anyone can talk about the end of the downtrend.
- Oil and US Iran talks: on November 3, 2026, signs of diplomatic progress pushed oil lower and gold initially bounced. If energy gets cheaper for good, the main reason behind rate hike expectations fades.
- The December Fed meeting and inflation data: a December hike is already partly priced in. The surprise would be the Fed stepping back from it.
- The next COT report: the first one to show positioning after the October 30 crash. If the Commercials index keeps moving toward 90, positioning turns favorable for buyers.
How to approach it as a trader
- Do not buy just because it is "cheap". Gold is 26.7% below its peak, but the trend is down and COT is not yet at an extreme.
- Separate the causes. Margin calls are temporary; rates and oil are not. Watch which of the two changes.
- Wait for positioning. A Commercials COT Index above 90 plus price confirmation (a close back above the broken level) is a stronger combination than any single headline.
- Limit risk in high volatility. Daily moves above 3% call for a wider stop and a smaller position. Size it with the risk calculator.
Frequently asked questions
Why did gold fall to its lowest price in a year?
Because of a combination of higher Fed rate expectations, expensive oil keeping inflation up, forced selling after the tech stock sell-off, ETF outflows and a technical break below $4,000.
How far has gold fallen from its record?
GC futures posted a record close of $5,318 on January 29, 2026 and settled at $3,899 on October 30, 2026, a decline of 26.7%.
Who is selling gold according to the COT report?
Mainly Large Speculators closing long positions. Their longs have dropped by 53,435 contracts since late August, while their shorts barely changed.
Is the crash a buy signal?
Not on its own. The Commercials COT Index is at 66.5, not above 90, price is below the 50 and 200 day SMAs, and the reasons for the selling (rates and oil) are still in place.
What could turn gold back up?
A lasting drop in oil, softer inflation, the Fed stepping back from a December hike or lower real yields. On the positioning side: a Commercials COT Index at an extreme.
Conclusion
Gold's crash is no mystery: the market repriced rates higher, and margin calls sped up the move. The headlines explain Friday, but the COT data show speculators had been leaving gold for two months. Now hedgers are covering, open interest is falling and positioning is being cleaned up. That is the groundwork for a bottom, not the bottom itself. See how we use the COT filter in real trades in our strategy, and follow the current COT Index and open interest for gold on fmoney.eu.
Want every market, signal and weekly analysis? Explore the membership plans.
Data: CFTC Legacy Futures Only, COMEX gold (088691), report as of October 27, 2026; prices: GC continuous front month, data through November 3, 2026. News: Reuters/CNBC, Kitco, Mining.com, InvestingLive, Yahoo Finance. Processing: fmoney.eu.
Trading futures and other financial instruments carries a high risk and is not suitable for everyone. This material is educational and is not investment advice.