Soybean COT Index: 10 Years of Extreme Positioning
On September 22, 2026, funds (Managed Money) held a net long of +265,159 contracts in soybeans (ZS), the largest since the data begins in 2006. Commercials took the other side, with a COT Index of 0. Five weeks later, soybeans have dropped from 1328 to 1229 cents per bushel, and funds are selling. When have we seen such extremes over the past ten years, what followed, and what does seasonality say? We checked every week since October 2016.
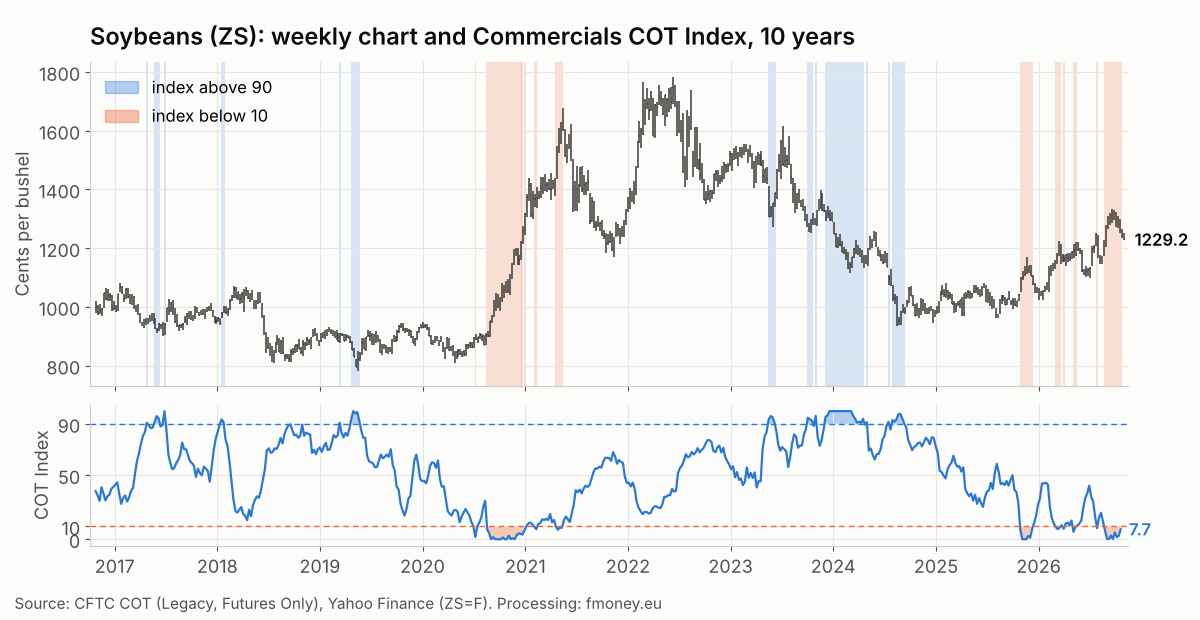
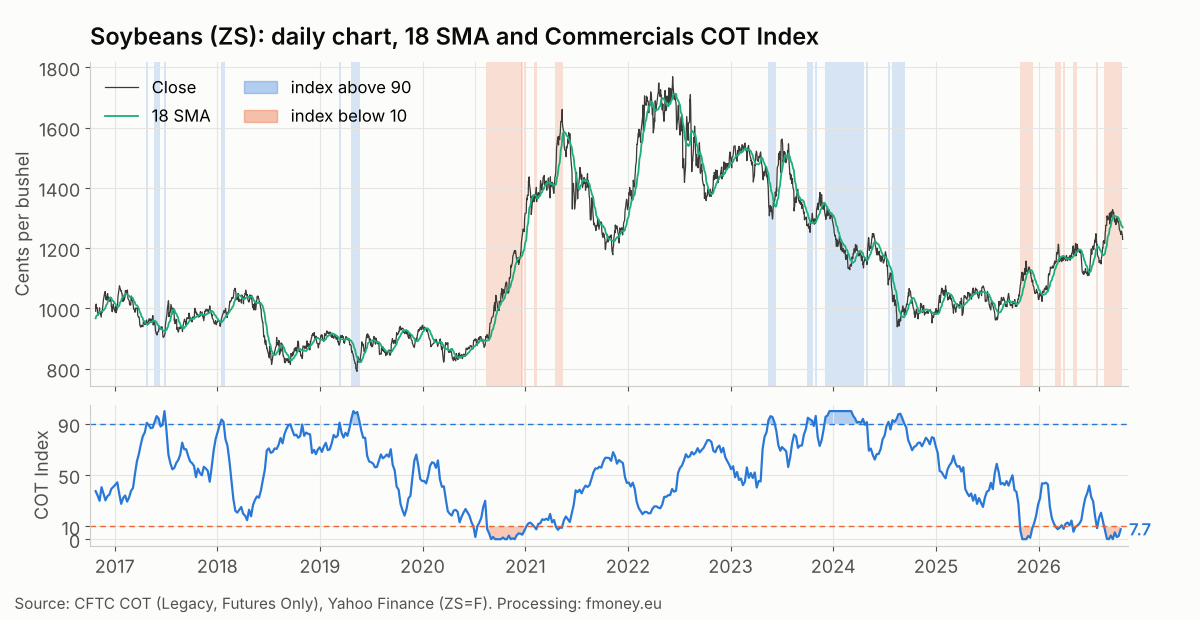
How we read the Commercials COT Index
Commercials in soybeans are crushers that produce soybean meal and soybean oil, grain merchants, exporters, and farmers hedging their crops. The CFTC COT report shows their net position (long minus short contracts) every week. The raw number says little on its own, so we put it in context with the COT Index.
COT Index = (current net position − 156 week minimum) / (156 week maximum − 156 week minimum) × 100
An index above 90 means Commercials are near their largest net long (or smallest net short) position of the past three years. An index below 10 means the opposite: they are selling aggressively and are near their largest net short. You can see the index for every market in our free COT demo.
Ten years of soybeans: how often we hit an extreme
From October 25, 2016 to October 20, 2026, there are 522 weekly COT reports for CBOT soybeans. Of these:
- 50 weeks with the index above 90, spread over 13 separate periods;
- 50 weeks with the index below 10, spread over 10 separate periods.
The index spends 81% of the time between 10 and 90. The longest periods sit in the middle of major trends. The index stayed below 10 for 20 weeks, from August 18 to December 29, 2020, while soybeans rose from about 901 to 1315 cents. It also stayed above 90 for 20 weeks, from December 5, 2023 to April 16, 2024, while the price fell from 1304 to about 1150 cents.
The two extreme points tell the same story. On November 24, 2020, Commercials held their largest net short of the period, −279,751 contracts, with the price at 1191 cents. Soybeans kept rising to 1660 cents on May 12, 2021. On March 5, 2024, they were net long +207,278 contracts at 1141 cents. The price fell further to 1134 cents on April 18 and only then rose to 1248 cents on May 20.
In soybeans, as in corn, Commercials rarely catch the exact top or bottom. Their extreme position shows that a trend is mature, not when it will end.
What follows the first week in the zone
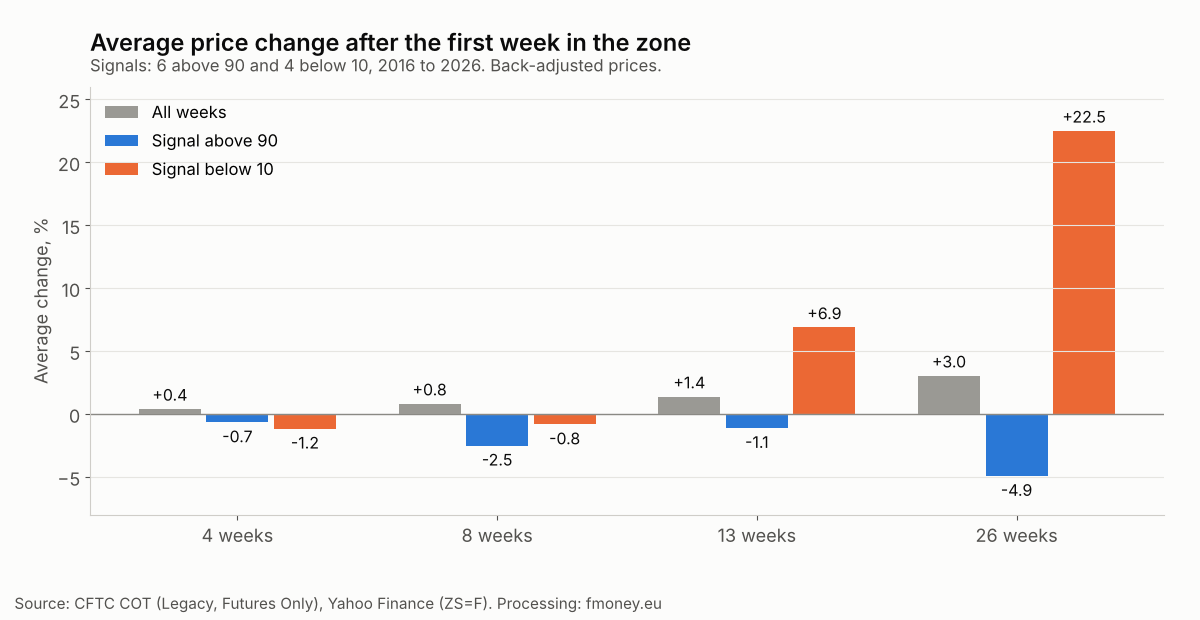
To put numbers on this, we ran a backtest. We take the first week the index enters a zone, with at least 26 weeks between two signals of the same type. Entry is the close on the Friday after the report date (when the CFTC publishes it). We measure the price change after 4, 8, 13 and 26 weeks and compare it with the average change across all weeks in the period. Soybeans roll the front month seven times a year (January, March, May, July, August, September and November), and the gap between old crop and new crop is often large, so prices are back-adjusted at every roll.
| Report date | Index | 4 weeks | 8 weeks | 13 weeks | 26 weeks |
|---|---|---|---|---|---|
| Above 90 | |||||
| 04/25/2017 | 90.8 | −3.1% | −5.4% | +4.7% | +2.3% |
| 01/16/2018 | 93.5 | +4.5% | +6.1% | +4.0% | −16.2% |
| 03/12/2019 | 90.9 | −1.5% | −12.3% | −3.5% | −3.9% |
| 05/16/2023 | 93.0 | +12.2% | +14.4% | +10.5% | +7.6% |
| 12/05/2023 | 95.6 | −4.2% | −10.5% | −11.8% | −13.5% |
| 07/16/2024 | 91.6 | −11.9% | −7.4% | −10.6% | −5.9% |
| Below 10 | |||||
| 07/07/2020 | 1.7 | −2.8% | +7.2% | +21.1% | +54.7% |
| 02/02/2021 | 9.7 | +4.9% | +2.3% | +18.3% | +6.3% |
| 10/28/2025 | 7.0 | −0.5% | −7.4% | −8.9% | +6.5% |
| 05/05/2026 | 5.8 | −6.3% | −5.4% | −3.0% | n/a |
The result is weak, and we say so plainly:
- Above 90 has not worked on average. Only 2 of 6 signals are positive after 4 and 8 weeks. On average, above 90 returns −2.5% over 8 weeks versus +0.8% for all weeks. The two winners share one catalyst, a weather problem: the Argentine drought in early 2018 (funds bought more than 300,000 contracts in 8 weeks) and the dry U.S. June of 2023. The four failures came with ample supply or weak demand: record South American crops in 2017, the trade war with China in 2019, expectations of a large Brazilian crop in late 2023, and excellent U.S. weather in July 2024.
- Below 10 has worked around trade meetings with China. Both signals followed by a decline came right before such meetings. The October 28, 2025 signal came two days before the Trump and Xi meeting in Busan: soybeans rose to 1157 cents on November 17 and then fell (−7.4% over 8 weeks). The May 5, 2026 signal came before the Beijing summit: the top was 1215 cents on May 13 and the low 1109 cents on June 24. Both times the top came with the news.
- Below 10 fails when China buys at record pace. The July 2020 and February 2021 signals were up 21.1% and 18.3% after 13 weeks.
- The latest episode is not in the table. The index fell below 10 again on August 25, 2026, but that is less than 26 weeks after the May signal, so we do not count it as new. From the August 28 close (1276 cents), the adjusted price is +0.7% after 4 weeks and −4.0% after 8 weeks.
For comparison, the average change across all weeks is +0.4% over 4 weeks, +0.8% over 8, +1.4% over 13 and +3.0% over 26 weeks. The sample is small: 6 signals above 90 and 4 below 10 in ten years. This is context for a decision, not a statistically proven system.
Seasonality in these periods
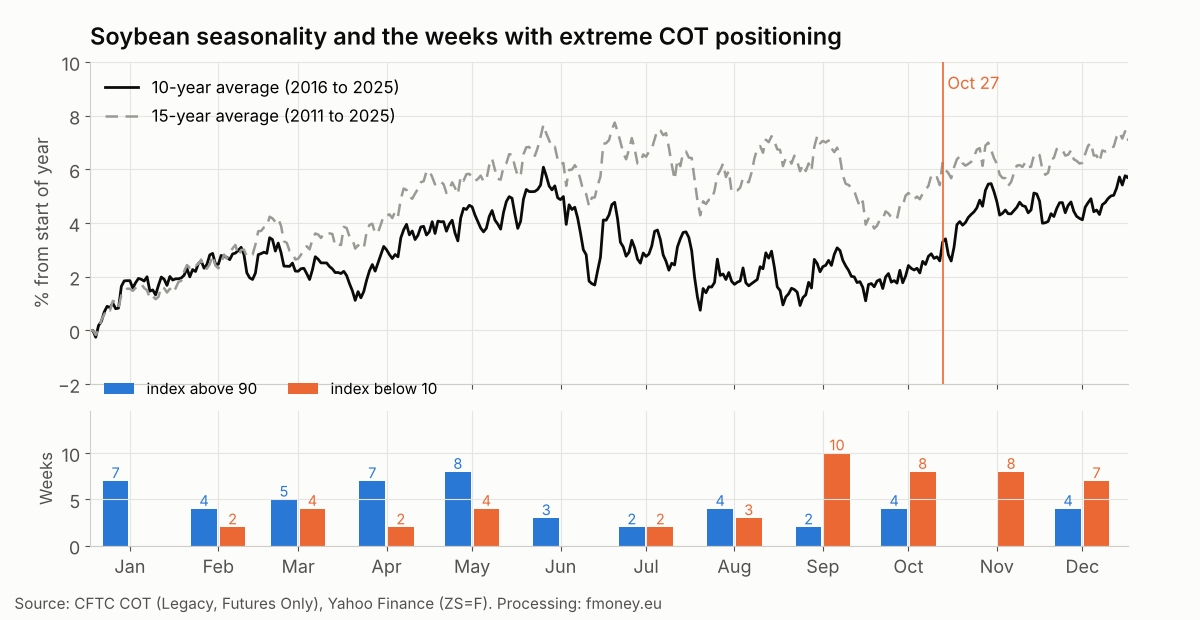
The average seasonal curve for the past ten years (2016 to 2025) follows the crop cycle in the U.S. and South America:
- January to early March: a rise to about +3% as the market watches weather in Brazil and Argentina;
- March and April: sideways, between +2% and +3%;
- May and the first half of June: a rise to the high of the year around June 9 (about +6%), when the market prices a U.S. weather premium;
- July and early August: a decline to about +1% around August 3, as the crop becomes clearer;
- August to mid October: sideways, around +2%;
- late October to year end: a rise to about +5% in mid November and about +6% at the end of December, as the export season begins.
The 15 year curve has a similar shape, with a high around July 4 (about +8%), a low around October 3 (about +4%) and a year end around +7%.
Weeks below 10 are most common from September to December (33 of 50), when the crop is known and funds have already bought. Weeks above 90 are most common from January to May (31 of 50), before U.S. planting.
Comparing the October 27 close with the end of December for each of the past ten years, the price finished higher in 5 of 10 years. The average change is +1.8%, but the median is −0.5%, because 2020 (+18.6%) pulls the average up. Over this window, seasonality gives no clear direction.
Where we are now
CFTC data as of October 20, 2026:
- Commercials net position: −221,638 contracts (COT Index 7.7, ninth week below 10);
- 4 week change: Commercials reduced their net short by 35,906 contracts;
- Managed Money net position: +221,325 contracts (156 week index 90.2), down from the record +265,159 on September 22;
- open interest: 1,093,612 contracts.
The August and September rally came from two pieces of news. On September 1, the EPA decided that biofuel demand lost to small refinery exemptions would be added back to the 2026 and 2027 requirements, and soybeans rose to their highest level in nearly three years. China was buying actively under the trade deal. On October 9, however, the USDA raised the yield to a record 53.1 bushels per acre and projected a record crop of 4.56 billion bushels. By October 18, 64% of the crop was harvested, and the price fell to its lowest level since late August.
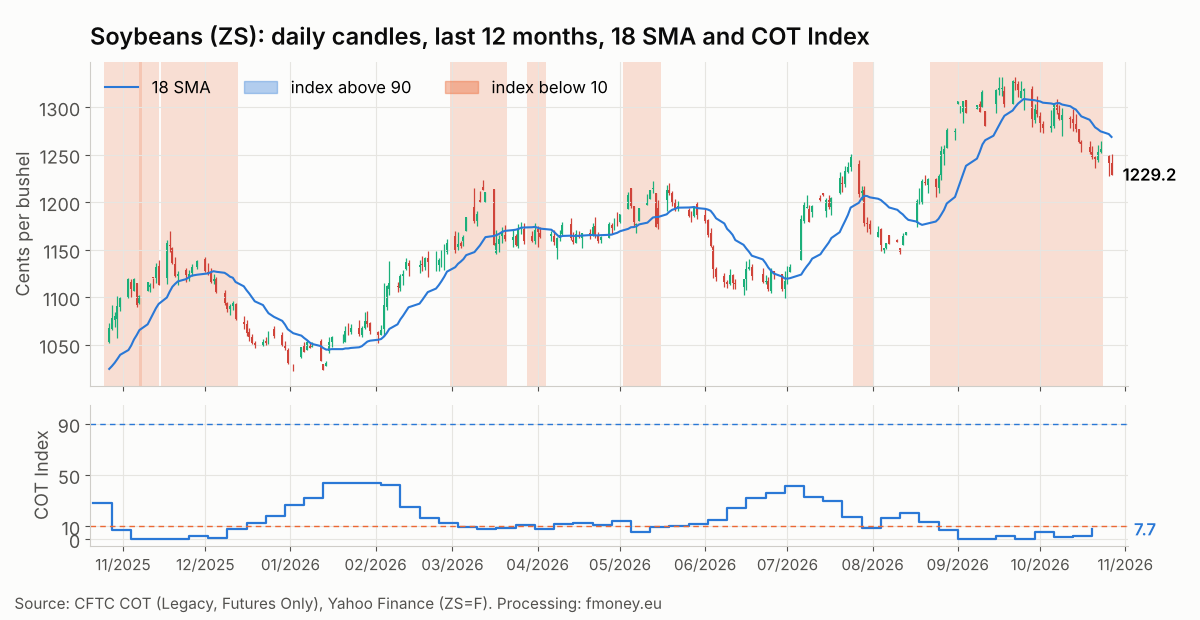
The daily chart shows the full cycle. From the 12 month low (1023 cents on January 13, 2026), soybeans rose to 1328 cents on September 21. On October 27, the close was 1229 cents, 7.4% below the high, just above the 200 day moving average (1218 cents) and below the 18 day moving average (1269 cents).
Here is what the three frames say right now:
- COT: the index has been below 10 since August 25. Funds have cut their long by only about 17% from the record and still have plenty to sell.
- Seasonality: neutral into year end; the price was higher in 5 of 10 years.
- Price: downtrend since September, below the 18 day average, just above the 200 day.
The scenario we are watching: so far, the below 10 episode is playing out like those of 2025 and May 2026, with a top that arrived with the bullish news. The risk to this view is the same as in 2020: if China accelerates purchases beyond the agreed amounts, Commercials can stay short for a long time while the price rises.
5 mistakes when trading COT extremes in soybeans
- Buying an index above 90 without a weather problem. 4 of 6 signals failed with ample supply. The two winners came with drought in Argentina and in the U.S.
- Selling an index below 10 while China buys at record pace. In 2020 and 2021, the price rose about 20% over 13 weeks while Commercials sold.
- Ignoring the news calendar. U.S. and China meetings, EPA biofuel decisions and USDA reports move soybeans more than positioning does. Both successful signals below 10 came right before trade meetings.
- Comparing old crop and new crop prices without adjustment. At the July to August, August to September and September to November rolls, the front month price can change by up to 10% in a day.
- Large size on a small sample. Ten signals in ten years are not statistics. Use the risk calculator and check open interest.
How we use it in practice
In our strategy, Commercials COT positioning is a mandatory filter: we do not look for long positions when Commercials are in an extreme short zone, and vice versa. In soybeans, the filter currently allows only short positions, seasonality gives no direction, and the trend is down after a record fund long. The entry comes from price structure and risk management, not from the index itself.
Frequently asked questions
How many times has the soybean COT Index been above 90 in ten years?
50 weeks out of 522, spread over 13 separate periods. The longest ran from December 5, 2023 to April 16, 2024 (20 weeks).
How many times has it been below 10?
50 weeks in 10 periods. The longest ran from August 18 to December 29, 2020 (20 weeks).
Is the September 2026 fund long a record?
Yes. +265,159 contracts on September 22, 2026 is the largest Managed Money net long since the data begins in 2006. The previous record was +240,937 contracts on May 1, 2012.
How did you calculate prices and seasonality?
We use the continuous front month ZS=F, back-adjusted on the first business day on or after the 15th of January, March, May, July, August, September and November, when the front month rolls. The charts show the actual front month price in cents per bushel.
Is this a signal to buy or sell soybeans now?
No. This is an analysis of historical data. The COT filter allows only short positions, but the entry must always come from price and from your own risk management.
Conclusion
Over ten years, soybean Commercials were at an extreme in about 19% of weeks. Their longest extremes coincide with major trends, not reversals. The above 90 zone has worked only with a weather problem and gives no edge on average. The below 10 zone has worked once the bullish news was already out and has failed when China bought at record pace. Today, soybeans are coming off a record fund long into a record crop, and Commercials are still in an extreme short position.
You can follow the current COT Index for soybeans and dozens of other markets in the free demo, and the weekly analysis and full toolset are in our membership plans.
Sources: CFTC Commitments of Traders (Legacy and Disaggregated, Futures Only), data as of 10/20/2026; Yahoo Finance (ZS=F), prices as of 10/27/2026; USDA WASDE and Crop Progress (October 2026); EPA (September 2026). Calculations: fmoney.eu. Futures trading involves a high risk of loss. This content is for educational purposes and is not investment advice. Past performance does not guarantee future results.