HRW Wheat COT Index: 10 Years of Extreme Positioning
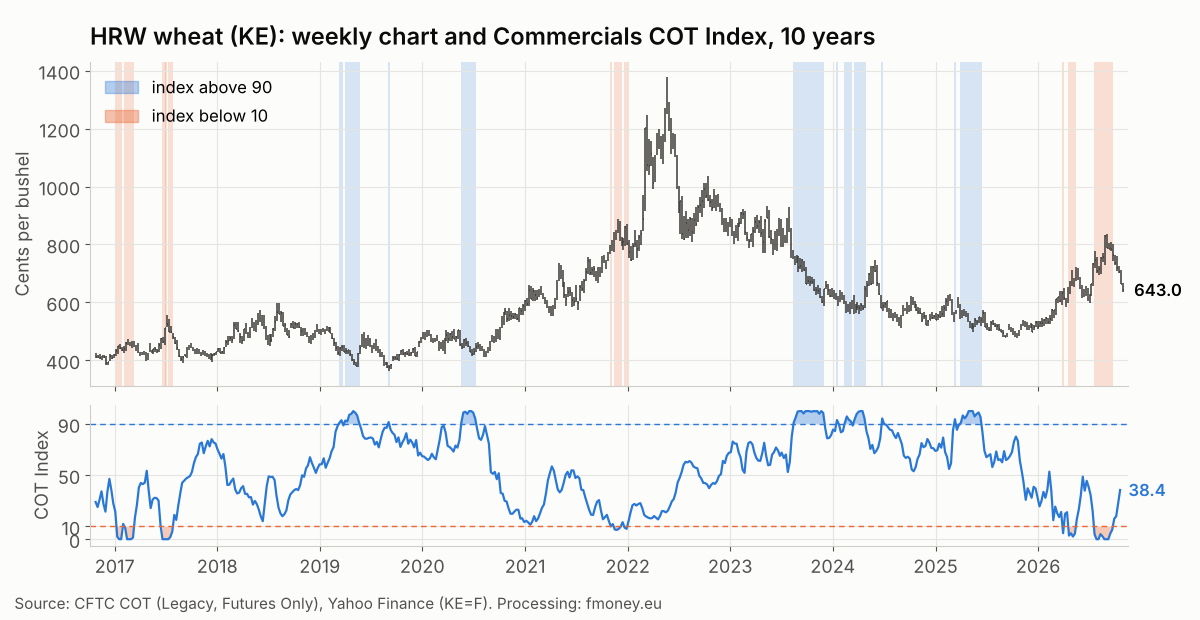
HRW wheat (KE) rallied 61% in eight months: from 514.75 cents per bushel at the end of 2025 to 827.75 cents on August 28, 2026. First came the drought in the Southern Plains, then the strikes on Black Sea ports. Commercials sold into the rally, and their COT Index stayed below 10 for ten straight weeks. Two months later, price is 22% lower. When have we seen extremes like this over the past 10 years, what followed, and what does seasonality say? We checked every week since October 2016.
How we read the Commercials COT Index
HRW (hard red winter) wheat is grown mainly in Kansas, Oklahoma and Texas. The KE futures contract trades in Chicago (CBOT). Commercials here are the farmers and elevators that sell the crop forward, merchants and exporters, and the flour mills that buy. The CFTC COT report shows their net position (long minus short contracts) every week. The raw number says little on its own, so we put it in context with the COT Index.
COT Index = (current net position − 156-week minimum) / (156-week maximum − 156-week minimum) × 100
An index above 90 means Commercials are close to their largest net long (or smallest net short) position of the past three years. An index below 10 means the opposite: they are selling aggressively and are close to their largest net short. You can see the index for every market in our free COT demo.
10 years of HRW wheat: how often we are at an extreme
From October 25, 2016 to October 20, 2026 there are 522 weekly COT reports for HRW wheat. Of these:
- 59 weeks with the index above 90, spread over 11 separate periods;
- 36 weeks with the index below 10, spread over 9 separate periods.
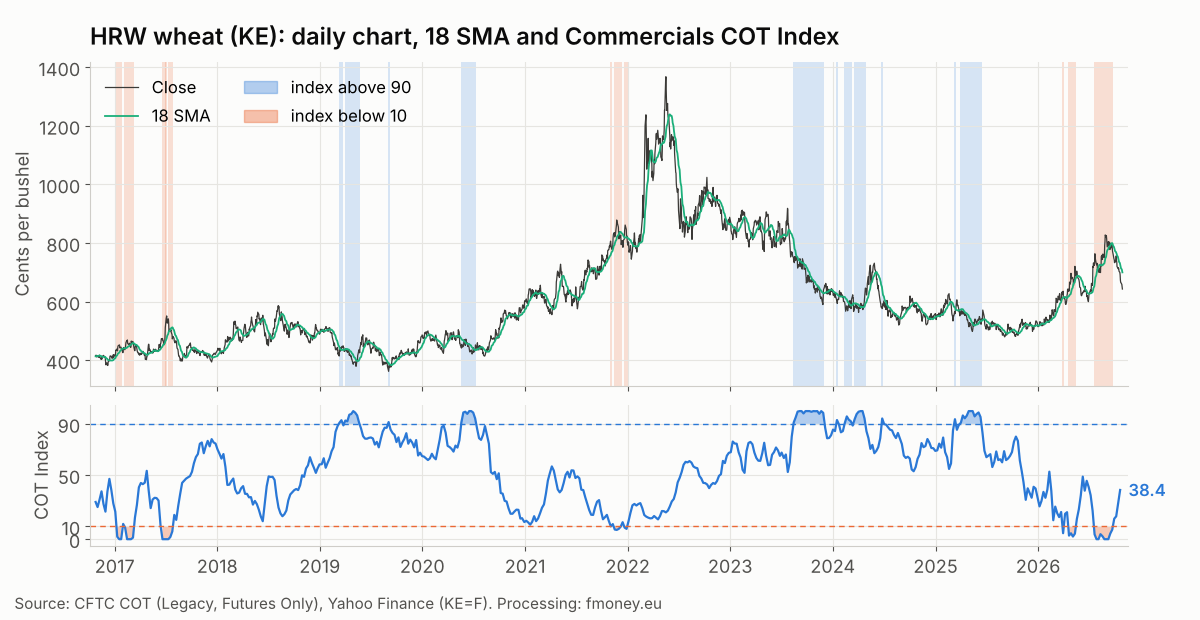
The index spends 82% of the time between 10 and 90. The longest above-90 period lasts 16 weeks, from August 15 to November 28, 2023, as price falls from 737.5 to 613 cents. The longest below-10 period lasts 10 weeks, from July 21 to September 22, 2026, right through the latest rally.
The two extreme readings show how differently the extremes behave. On July 11, 2017, Commercials held their largest net short of the period, −92,820 contracts, at 541 cents. That was four trading days after the 551.25 cent peak on July 5. By December 12, 2017, price had fallen to 394 cents (−28%). On May 13, 2025, they held their largest net long, +60,103 contracts, at 502 cents. Price rose to 571.25 cents by June 18, but then fell to 479.75 cents on September 4, 2025, below the May level.
In HRW wheat the record Commercials short was an accurate top signal. Their record long gave only a short bounce.
What follows the first week in the zone
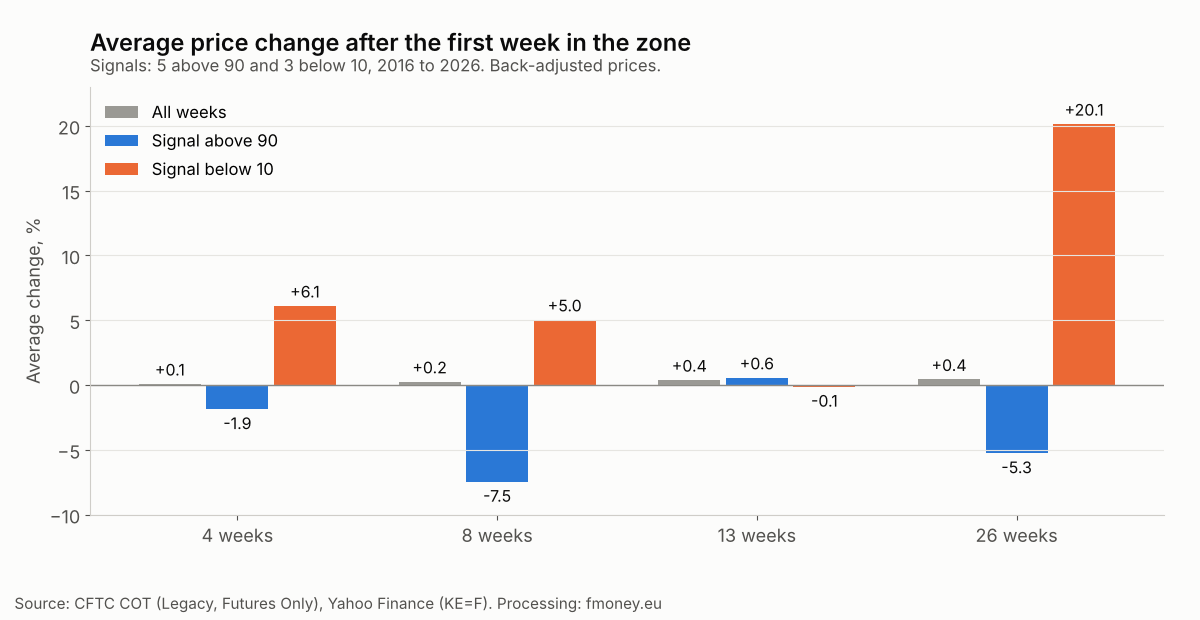
To test this with numbers, we ran a backtest. We take the first week the index enters a zone, with at least 26 weeks between two signals of the same type. Entry is the close on the Friday after the report date (when the CFTC publishes it). We measure the price change after 4, 8, 13 and 26 weeks and compare it with the average change for all weeks in the period. Wheat rolls its front month five times a year (March, May, July, September and December), so prices are back-adjusted at every roll.
| Report date | Index | 4 wks | 8 wks | 13 wks | 26 wks |
|---|---|---|---|---|---|
| Above 90 | |||||
| 03/12/2019 | 90.9 | −2.0% | −14.4% | +7.4% | −11.1% |
| 05/19/2020 | 91.2 | −3.7% | −3.7% | −4.4% | +19.8% |
| 08/15/2023 | 91.1 | −5.6% | −15.4% | −21.9% | −30.1% |
| 02/13/2024 | 90.8 | +8.2% | +12.6% | +35.6% | +20.2% |
| 03/11/2025 | 93.7 | −6.2% | −16.4% | −13.9% | −25.1% |
| Below 10 | |||||
| 01/10/2017 | 1.9 | +2.6% | −0.8% | −7.8% | +7.8% |
| 11/02/2021 | 10.0 | +5.6% | +5.5% | +3.4% | +42.3% |
| 03/31/2026 | 4.7 | +10.1% | +10.4% | +4.0% | +10.3% |
The result runs against the textbook, and we say so plainly:
- Above 90 has led to declines on average. Only 1 of 5 signals is higher after 4 and after 8 weeks. The average 8-week change is −7.5% versus +0.3% for all weeks. The only success is February 13, 2024: price was 25% below its 200 day average, and in May frost led three Russian grain regions to declare a state of emergency (+35.6% over 13 weeks). In the four failures Commercials bought fast, 12k to 27k contracts in 4 weeks, in a market that kept falling. The March 2025 failure ended with new contract lows in late April, when rain in the Plains rescued the crop.
- Below 10 is not an immediate sell signal. All three signals were higher after 4 weeks (+6.1% on average). In 8 of the 9 below-10 episodes since 2016, price first rose, by 1.9% to 18.7% over the next 8 weeks. The top comes after the signal, not at it.
- The decline comes when the supply shock ends. In July 2017 the spring wheat drought pushed price higher first, and only then came a 28% decline. In November 2021 the rally ran on to a nine-year high and fed into the 2022 prices. In March 2026 the Kansas drought had not yet hit its worst.
- The latest episode is not in the table. The index dropped below 10 again on July 21, 2026, but that is less than 26 weeks after the March signal, so we do not count it as a new one. From the July 24 close (745.25 cents) the adjusted price is +1.5% after 4 weeks, +2.8% after 8 and −12.9% after 13 weeks. The 827.75 cent peak came on August 28, after the strikes on the port of Novorossiysk.
For comparison, the average change for all weeks is +0.1% over 4 weeks, +0.3% over 8, +0.4% over 13 and +0.4% over 26 weeks. The sample is small: 5 signals above 90 and 3 below 10 in 10 years. This is context for a decision, not a statistically proven system.
Seasonality in these periods
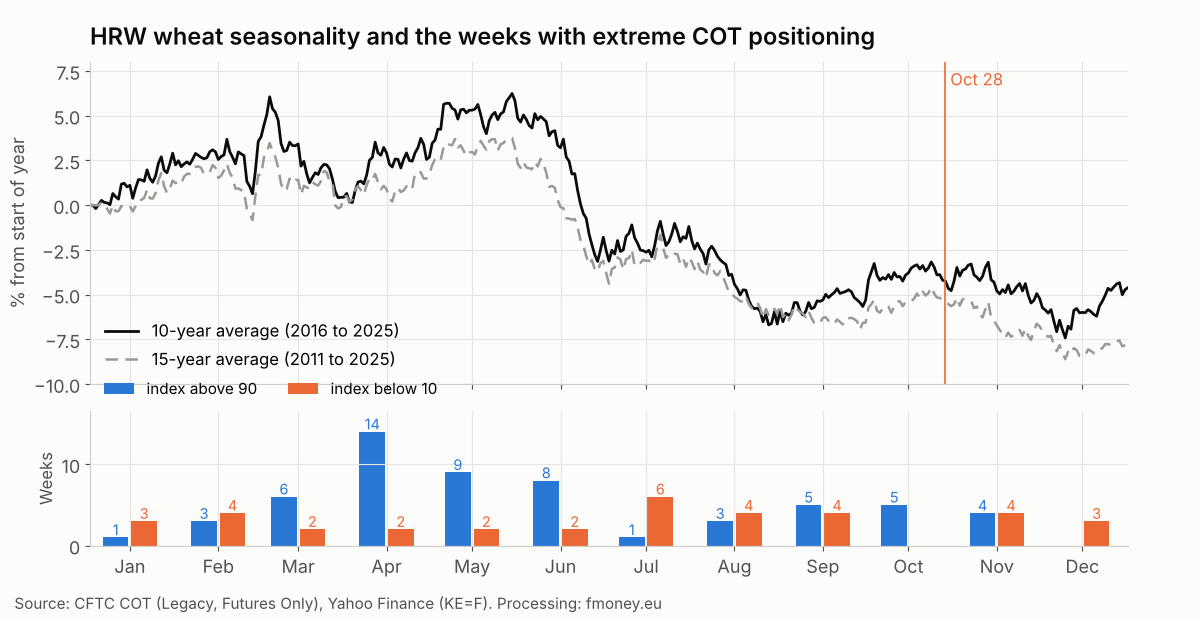
The average seasonal curve for the last 10 years (2016 to 2025) follows the winter wheat cycle:
- January to early March: a rise to about +3% as the market watches the crop come out of winter;
- March and April: swings between 0% and +3%;
- May: a rise to the high of the year around May 29 (about +6%), as the market prices drought risk ahead of harvest;
- June: a sharp drop to about −3% by the end of the month, as harvest starts in Texas, Oklahoma and Kansas;
- July and August: a decline to the summer low around September 1 (about −6.5%);
- September and October: a bounce to about −4% during planting;
- November and December: a new decline to about −7% in early December and a year end of about −4.6%.
The 15-year curve has a similar shape but is weaker: a peak of about +4% in late May and a year end of about −8%.
Above-90 weeks are most common from March to June (37 of 59), before harvest, when farmers have not yet sold. Below-10 weeks are spread more evenly, with the most from July to September (14 of 36).
Comparing the October 28 close with the end of December for each of the last 10 years, price finished higher in only 3 of 10 years. The average change is −0.5% and the median −2.8%. The average is pulled up by the three years with gains (2019, 2020 and 2021). In a typical year, seasonality in this window is negative.
Where we are now
CFTC data as of October 20, 2026:
- Commercials net position: +1,191 contracts (COT Index 38.4, out of the below-10 zone since September 29);
- 4-week change: Commercials bought 29,594 contracts;
- Managed Money net position: +7,490 contracts (156-week index 67.2), down from +48,826 on September 1;
- open interest: 320,369 contracts.
The 2026 rally came in two waves. The first was the drought in the Southern Plains: by late April more than 40% of Kansas wheat was rated poor or very poor, and KE reached 720.5 cents on May 12. The second was the war in the Black Sea: in August Ukrainian drones shut all three grain terminals at Novorossiysk, which handles about 40% of Russian grain exports. On August 12 the USDA cut the HRW crop to 463 million bushels. In recent weeks the pressure has come from news that Russia agreed to resume peace talks. US wheat exports remain weak, and winter wheat planting is behind.
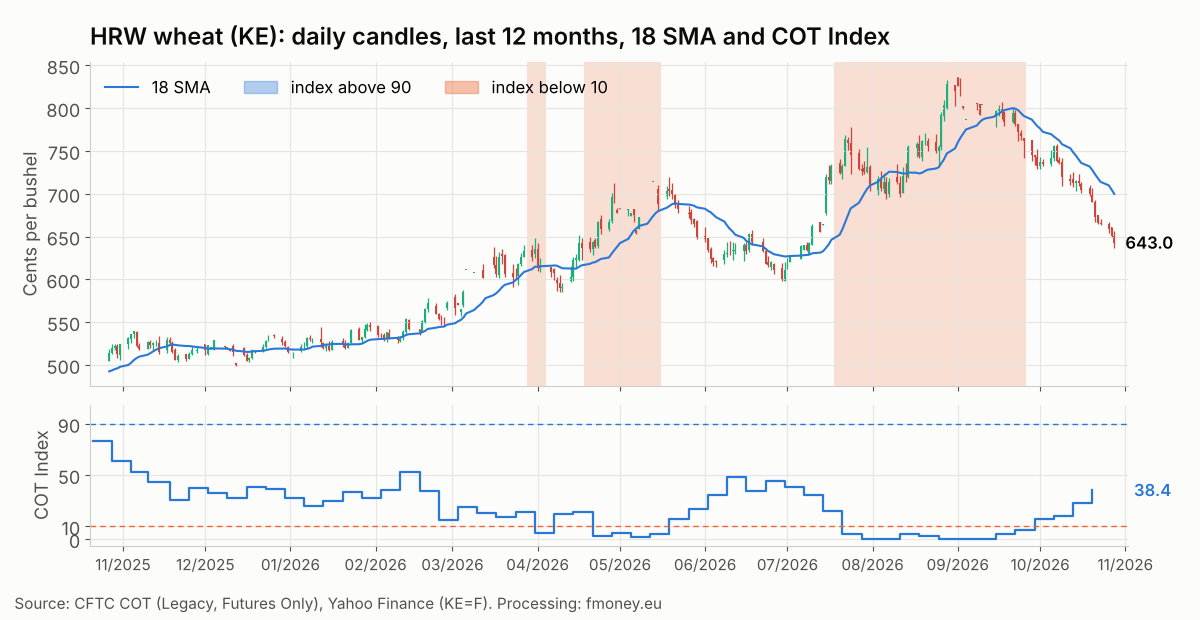
The daily chart shows the full cycle. From the 12-month low (498.75 cents on December 12, 2025) wheat climbed to 827.75 cents on August 28, 2026. On October 28 it closed at 643 cents, 22.3% below the peak and about 8% below both the 18 day average (699.9 cents) and the 200 day average (701.1 cents).
The three frameworks currently say:
- COT: the index is 38.4 and rising fast. No signal under our filter. Funds have already sold most of their long.
- Seasonality: negative into year end, higher in only 3 of 10 years.
- Price: a downtrend, below both averages.
The scenario we are watching: the summer below-10 episode played out like those of 2017 and 2021, with a top a few weeks after the signal and a sharp decline once the supply shock faded. There is no extreme now. The next point of interest will be an index above 90 in winter or spring. History says such a signal only has a chance with price far below the 200 day average and without fast buying by Commercials.
5 mistakes when trading COT extremes in HRW wheat
- Buying an index above 90 while Commercials buy fast. All four failures came with purchases of 12k to 27k contracts in 4 weeks in a falling market.
- Selling in the first week below 10. In 8 of 9 episodes price first rose, by up to 18.7%. Wait for a close below the 18 day average.
- Ignoring weather and war. Drought in the Plains, frost in Russia and strikes on Black Sea ports move wheat more than positioning does.
- Comparing prices across contracts without adjustment. On the May to July and July to September rolls, the front month can move 7% to 8% in a day.
- Large size on a small sample. 8 signals in 10 years are not statistics. Use the risk calculator and check open interest.
How we use it in practice
In our strategy Commercials positioning is a mandatory filter: we do not look for longs when commercials are in an extreme short zone, and vice versa. In HRW wheat the filter currently gives no direction, seasonality is negative, and the trend is down after a strong rally. Entries come from price structure and risk management, not from the index itself.
Frequently asked questions
How many times has the HRW wheat COT Index been above 90 in 10 years?
59 weeks out of 522, spread over 11 separate periods. The longest ran from August 15 to November 28, 2023 (16 weeks).
How many times has it been below 10?
36 weeks in 9 periods. The longest ran from July 21 to September 22, 2026 (10 weeks).
What is the difference between KE and ZW?
KE is hard red winter wheat (HRW), a bread wheat grown in the Southern Plains. ZW is soft red winter wheat (SRW) from the eastern US. The two contracts often move together, but drought in Kansas hits KE the most.
How did you calculate prices and seasonality?
We use the continuous front month KE=F, back-adjusted on the first trading day on or after the 15th of March, May, July, September and December, when the front month rolls. The charts show the actual front-month price in cents per bushel.
Is this a signal to buy or sell wheat now?
No. This is an analysis of historical data. The COT Index is currently in the neutral zone, and the filter gives no direction.
Conclusion
Over 10 years, HRW wheat Commercials were at an extreme in about 18% of weeks. Here the extremes work against expectations. Above 90 has led to declines on average and worked only once, with price far below its average and a shock in Russia. Below 10 came in the middle of rallies: price first kept rising, and the decline came only once the supply shock faded. Today wheat is 22% below its August peak, funds have exited most of their longs, and Commercials are no longer at an extreme.
You can follow the current COT Index for wheat and dozens of other markets in the free demo, and the weekly analysis and full tools are in our membership plans.
Sources: CFTC Commitments of Traders (Legacy and Disaggregated, Futures Only), data as of 10/20/2026; Yahoo Finance (KE=F), prices as of 10/28/2026; USDA WASDE (8/12/2026); Farm Progress (5/7/2026); World Grain (August 2026); Price Futures Group (10/26/2026); Reuters (5/9/2024, 4/28/2025). Calculations: fmoney.eu. Futures trading carries a high risk of loss. This content is for educational purposes and is not investment advice. Past performance does not guarantee future results.