How to read the COT report: a practical guide for futures traders
Every Friday evening the US Commodity Futures Trading Commission (CFTC) publishes one of the most valuable free sources of information on futures markets: the Commitments of Traders report, or COT for short. Most traders either do not know it exists or open it once, see a wall of numbers and close it. In this guide you will learn exactly what the report shows, which numbers matter and how to turn them into a working tool, with a real example from corn in October 2026.
What is the COT report?
The COT report shows how different groups of participants are positioned in US futures markets, from corn and soybeans to gold, crude oil, currencies and stock indices. Brokers must report to the CFTC the positions of all accounts above a certain threshold, and the Commission aggregates them by group and publishes them once a week.
A few things to know from the outset:
- The data is as of Tuesday. The report reflects positions at the close of trading on Tuesday.
- It is published on Friday. The standard time is 3:30 pm New York time. Publication is delayed by US holidays, and during a federal government shutdown the reports may not be released at all until the government reopens.
- It is not a day trading tool. Three days pass between the data and its publication. COT is most useful for medium term trading, from a few weeks to a few months.
Which report to use: Legacy, Disaggregated or TFF
The CFTC publishes several versions of the report. At first this confuses people more than the numbers themselves.
- Legacy (classic): splits participants into three groups: Commercials, Non Commercials and Non Reportable. It has decades of history, and most classic COT methods are built on it. If you are just starting out, start here.
- Disaggregated: for commodity markets. It splits Commercials into producers/merchants and swap dealers, and speculators into Managed Money and others.
- Traders in Financial Futures (TFF): for financial futures: currencies, interest rates, stock indices.
Each version comes as "Futures Only" and "Futures and Options Combined". For this guide we use Legacy, Futures Only.
The three groups of participants
The key to COT analysis is understanding who stands behind each group and why they trade.
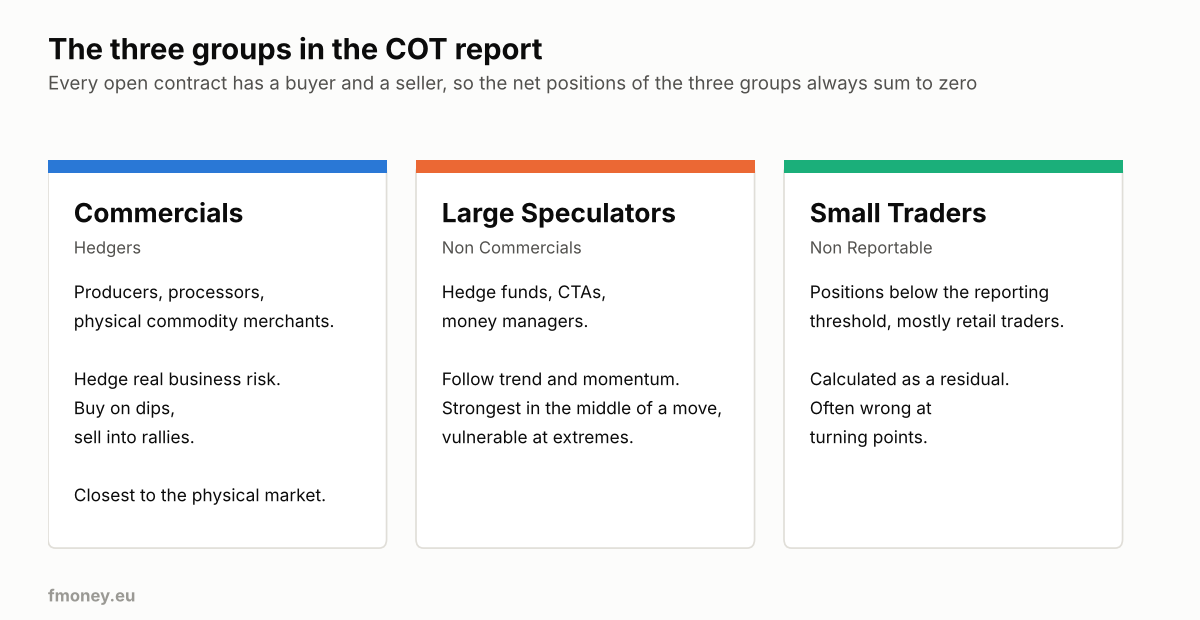
Commercials: the hedgers
These are farmers, processors, grain elevators, refiners, mining companies: businesses that produce or use the physical commodity. They do not trade to profit from futures but to insure their real business. That is why their behaviour is countercyclical: they sell more and more as prices rise (to lock in a good price for their output) and buy as prices fall. They are closest to the physical market and see supply and demand from the inside.
Large Speculators
In the Legacy report they are called Non Commercials: hedge funds, CTAs, money managers. They trade for profit and in most cases follow the trend. They are the ones who drive price in the middle of a big move. Their problem is that at extremes they are all loaded in one direction, and when the trend turns, everyone wants to get out at once.
Small Traders
Non Reportable positions are everything below the reporting threshold, mostly retail traders. The CFTC does not report them directly but calculates them as the residual of total open interest. Historically this group is often positioned the wrong way at turning points, but in most markets it is small and rarely gives a signal on its own.
How to read a row of the report
Here is the actual data for corn (CBOT) as of Tuesday, October 20, 2026:
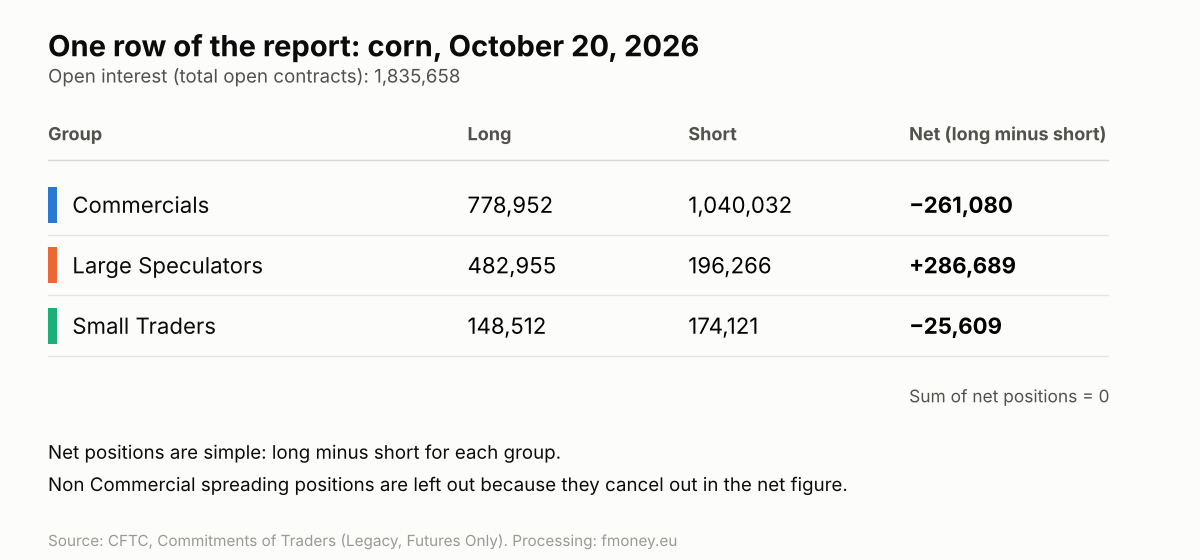
On its own this row says little. The trader's job is to answer three questions:
- What is each group's net position? Long minus short. As of 10/20/2026, corn Commercials are net short 261,080 contracts and Large Speculators are net long 286,689.
- How has it changed since last week? A week earlier Commercials were net short 326,958 contracts: in one week they reduced their net short by almost 66 thousand.
- Where is it relative to its own history? This is the most important question, and the COT index answers it.
Note that the net positions of the three groups always sum to zero. Every futures contract has a buyer and a seller: when speculators are net long, somebody else is net short.
From raw numbers to a signal: the COT index
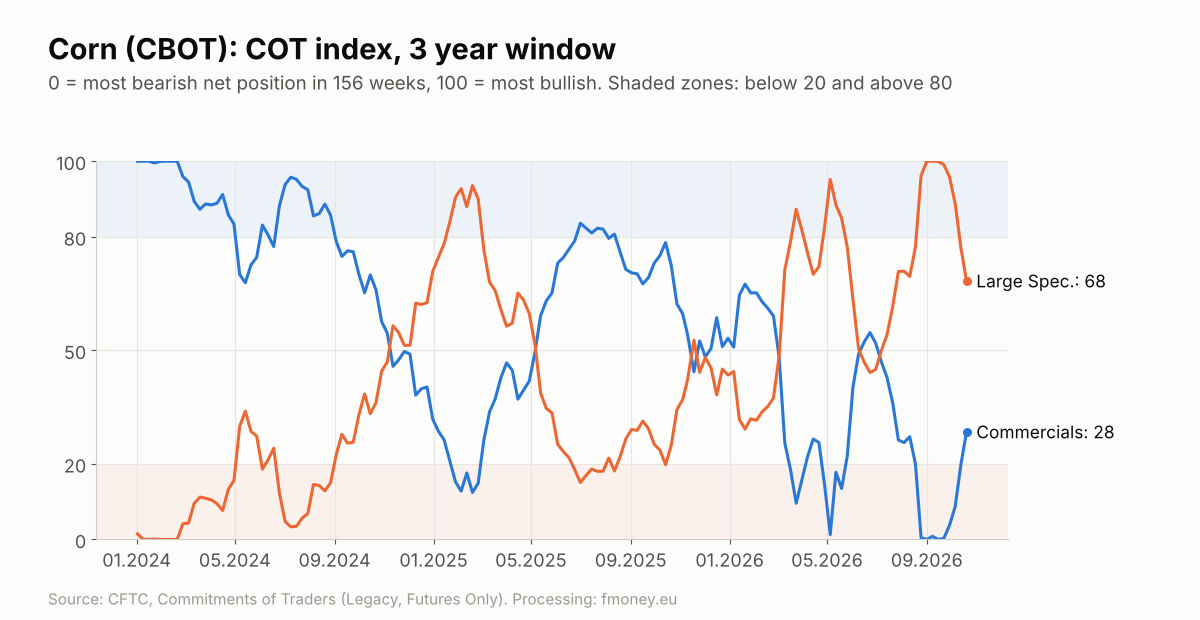
"Net short 261 thousand contracts": is that a lot or a little? It depends on the market and the period. That is why raw numbers are normalised into a COT index, a 0 to 100 scale showing where the current net position sits relative to the minimum and maximum for a chosen period:
COT index = (current net position minus period minimum) ÷ (period maximum minus period minimum) × 100
- 100 means the group has its most bullish position for the period.
- 0 means its most bearish position for the period.
- Values above 80 and below 20 are traditionally regarded as extremes worth paying attention to.
The most common window is 3 years (156 weeks). A shorter window (for example 26 weeks) reacts faster but gives more false signals.
A real example: corn in September and October 2026
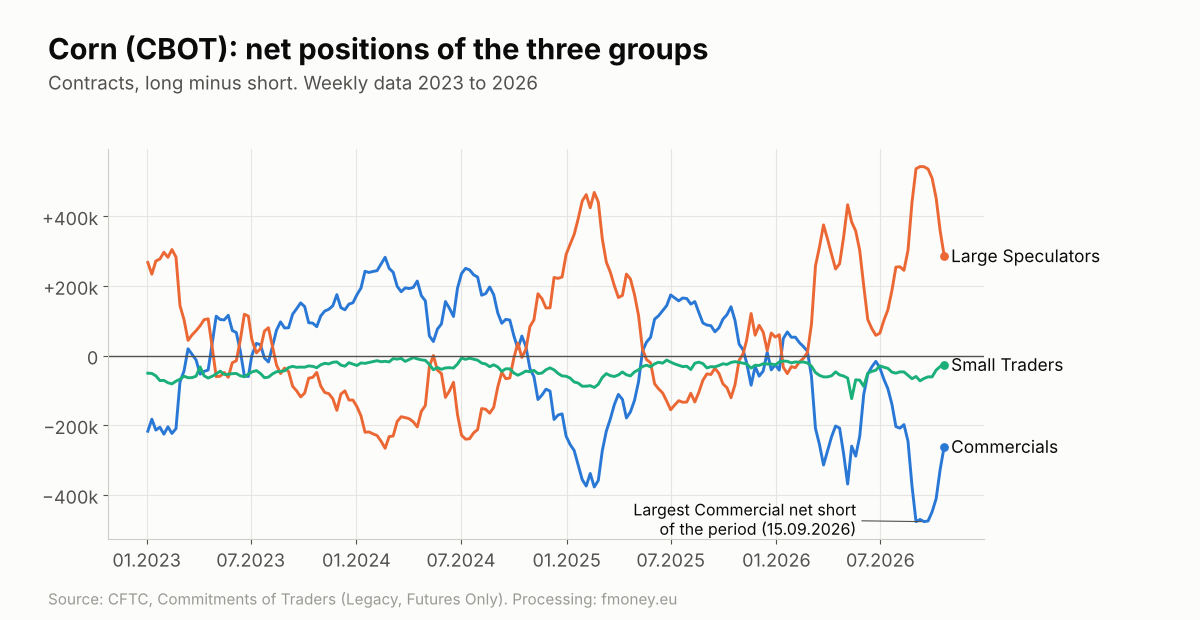
Here is what the CFTC data shows:
- September 15, 2026. Commercials are net short 476,845 contracts, their largest net short of the whole period since 2023. Their COT index (3 years) is 0. At the same time Large Speculators are net long 542,384 contracts, with a COT index close to 100.
- The next five weeks. The picture reverses sharply. By October 20, Commercials cut their net short by 215,765 contracts and speculators reduced their net long by 255,695.
- October 20, 2026. The Commercials' COT index is now 28 and the speculators' 68.
How to read this? In mid September positioning was at a historical extreme: funds were massively long and hedgers massively short. Such a picture is not an entry signal on its own, because extremes can persist for weeks. What matters is what comes next: when the extreme starts to unwind quickly, it is a sign that the balance of power is shifting. The speed of that change is exactly what our COT Speed Index measures.
Notice something else too: in this example we deliberately do not talk about price. The COT report answers the question of who is positioned and how, not when to enter. For timing you need the chart.
5 mistakes when reading the COT report
- Trading on COT alone. Extreme positioning can last for weeks and sometimes months. COT says "pay attention here", not "enter now".
- Looking at absolute numbers. 100 thousand contracts in corn and 100 thousand in gold are completely different things. Normalise with a COT index.
- Comparing markets with different structures. In some markets (for example financial futures) Commercials do not play the same role as in commodities. The method has to fit the market.
- Ignoring open interest. A change in net positions with rising open interest means new money entering the market. With falling open interest, positions are being closed. These are different stories. More on this in the Open Interest section.
- Forgetting that the data is delayed. The report is as of Tuesday. If the market made a big move on Wednesday and Thursday, positions are already different.
How to include COT analysis in your trading
Here is a simple framework that works as a starting point:
- COT as a filter. Every week, check which markets have Commercials at an extreme (COT index below 20 or above 80). This is your watch list, not a list of trades.
- The chart for timing. In the markets on the list, look for a technical signal in the direction of the Commercials: a breakout, a reversal pattern, a retest of a level.
- Risk first. Set your stop and position size before you enter. You can use our risk calculator.
That is exactly how our strategy is built: COT data sets the direction and the markets, technical analysis sets the timing, and risk management keeps you in the game.
Frequently asked questions
When is the COT report released?
Every Friday at 3:30 pm New York time, with data as of Tuesday of the same week. Publication is delayed by US holidays.
Is the COT report free?
Yes. The CFTC publishes all reports free of charge on its website, including historical data going back decades.
Which group is the most important in the COT report?
For commodity markets, the Commercials (hedgers). They are closest to the physical market, and their positions at historical extremes often precede important turning points. Large Speculators are useful as a mirror indicator.
Is COT analysis suitable for short term trading?
Not as a standalone method. The data comes out once a week with a three day lag, so COT is most useful over a horizon of weeks to months. For short term trades it can serve as a directional filter.
What is a COT index?
A normalisation of a group's net position on a scale of 0 to 100 relative to its minimum and maximum over a chosen period, most often 3 years. It lets you compare positioning over time and across different markets.
Conclusion
The COT report is not the Holy Grail. But it is one of the few places where you can see not what the big players say, but what they do with their money. Net positions normalised into a COT index show you when a market has reached an extreme. The speed at which that extreme unwinds shows you when the balance is shifting. And the chart shows you when to act.
If you want to see these tools in action on all major futures markets (COT Index, COT Spread and COT Speed Index), take a look at the free demo. And when you are ready for full access, the weekly analyses and the strategy rules, the membership plans are here.
Futures trading carries a high level of risk and is not suitable for every investor. The content of this article is for educational purposes and does not constitute investment advice. Data: CFTC, Commitments of Traders (Legacy, Futures Only), as of October 20, 2026.