Crude Oil COT Index: 10 Years of Extreme Positioning
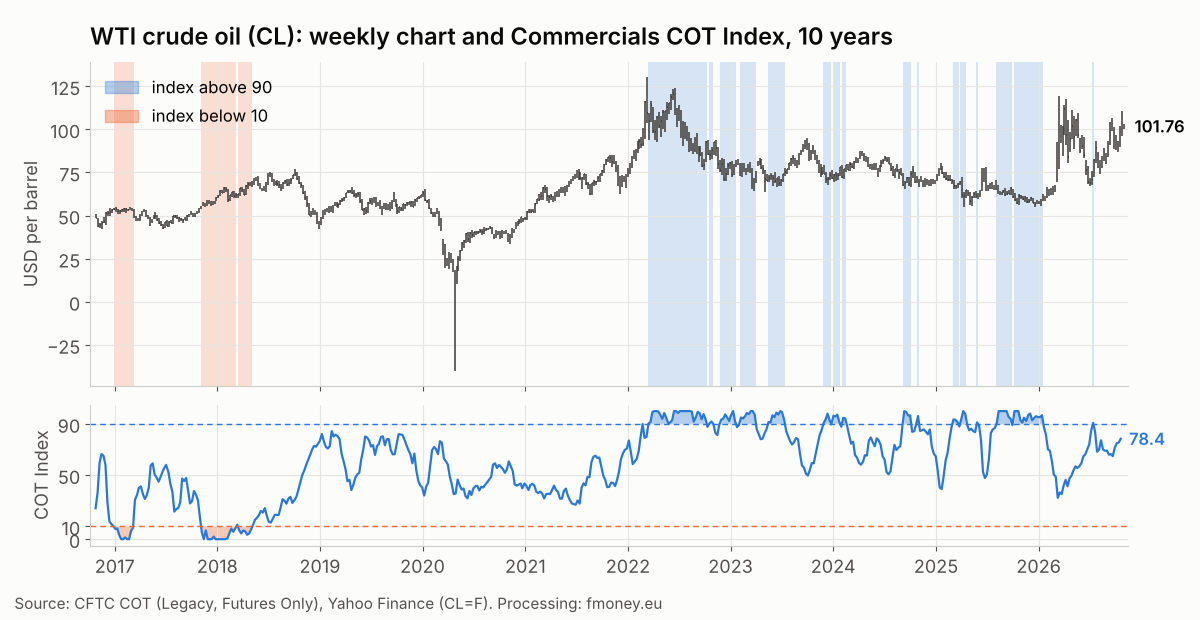
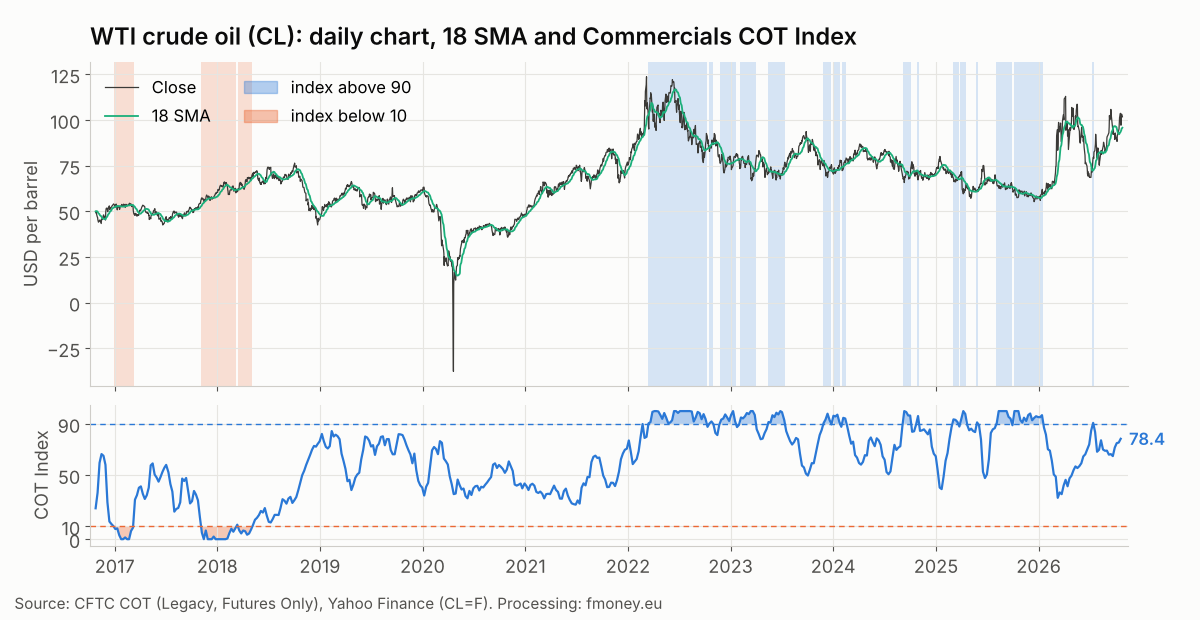
On October 26, 2026, WTI crude oil (CL) closed at $101.76 per barrel, 19% above its 200-day moving average. The US-Iran war and the risks in the Strait of Hormuz have lifted the price from $55 in December 2025 to above $100. Commercial traders, however, are not at an extreme: their COT Index stands at 78.4. When were there extremes over the past 10 years, what followed, and what does seasonality say? We checked every week since October 2016.
How we read the Commercials COT Index
Commercials in crude oil are producers, refiners, merchants and the banks that provide them with hedges (swap dealers). The CFTC COT report shows their net position (long minus short contracts) every week. Producers sell their future output forward, so Commercials in WTI are always net short. The raw number says little on its own, so we put it into context with the COT Index.
COT Index = (current net position − 156-week minimum) / (156-week maximum − 156-week minimum) × 100
An index above 90 means Commercials are close to their smallest net short position of the past three years. An index below 10 means the opposite: they are selling aggressively and are near their largest net short position. You can see the index for every market in our free COT demo.
10 years of crude oil: how often we reach an extreme
From October 25, 2016 to October 20, 2026 there are 522 weekly COT reports for NYMEX WTI. Of these:
- 103 weeks with the index above 90, in 16 separate periods;
- 35 weeks with the index below 10, in 3 periods.
The distribution is very uneven. Every week below 10 falls between January 2017 and May 2018. Every week above 90 comes after March 2022. The reason is a structural shift in the market. In 2018, Managed Money (the funds) held on average 334 thousand net long contracts; in 2025 and 2026, about 78 thousand. The less the funds buy, the less producers need to sell against them. The Commercials net short position shrank from −764,797 contracts on January 30, 2018 to −55,056 contracts on October 21, 2025, the smallest of the whole period. The three-year window of the index cannot keep up with such a long trend, which is why the index is so often above 90.
The two extremes tell different stories. At the record short position on January 30, 2018, crude was at $64.50 and kept rising to $74.15 by the end of June. At the smallest short position on October 21, 2025, crude was at $57.82, fell to $55.27 on December 16, and after the start of the war with Iran rose above $100.
What follows the first week in the zone
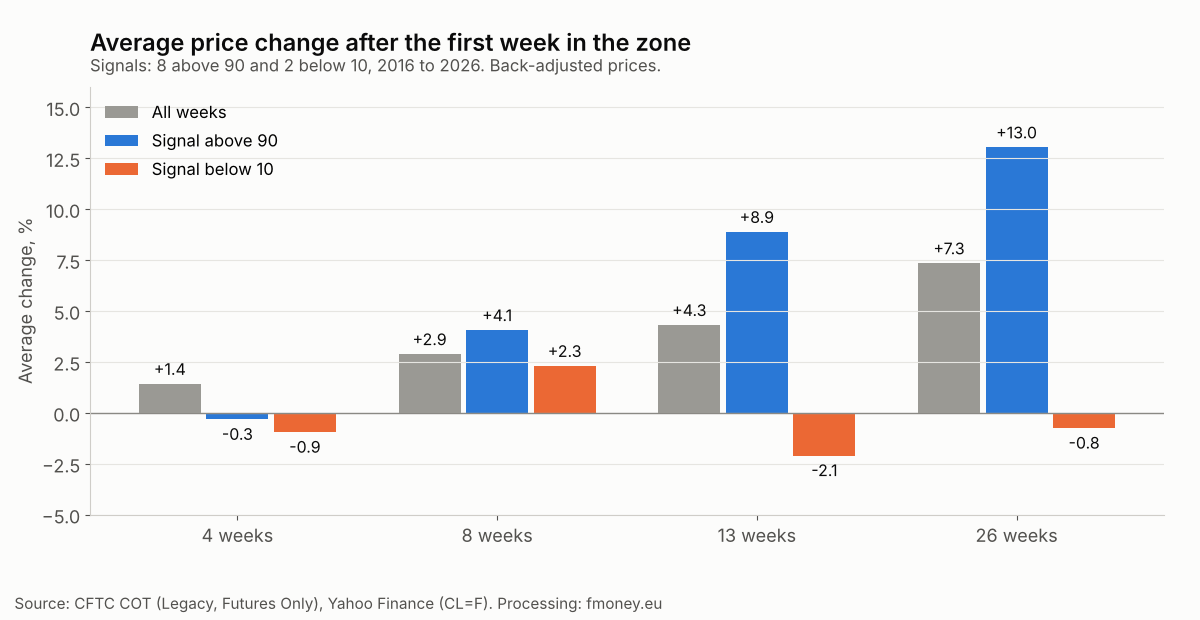
To test this in numbers, we ran a backtest. We take the first week in which the index enters a zone, with at least 26 weeks between two signals of the same type. Entry is the close on the Friday after the report date (when the CFTC publishes it). We measure the price change after 4, 8, 13 and 26 weeks and compare it with the average change for all weeks in the period. Crude oil rolls to a new front month every month, so prices are back-adjusted on the day after each expiry. For April 2020, when the May contract went below zero, we use the June contract.
| Report date | Index | 4 wk | 8 wk | 13 wk | 26 wk |
|---|---|---|---|---|---|
| Above 90 | |||||
| 03/15/2022 | 90.4 | −0.7% | +1.6% | +3.4% | −14.5% |
| 10/18/2022 | 90.4 | −5.8% | −9.3% | −3.5% | −8.0% |
| 05/16/2023 | 91.5 | −0.9% | +1.2% | +6.9% | +6.4% |
| 11/28/2023 | 90.6 | −2.8% | +7.0% | +10.0% | +8.4% |
| 09/10/2024 | 100.0 | +12.5% | +6.7% | +6.2% | +4.1% |
| 04/01/2025 | 94.1 | −2.9% | +2.9% | +23.1% | +12.4% |
| 10/07/2025 | 100.0 | +0.3% | +2.7% | +0.4% | +82.4% |
| 07/14/2026 | 90.8 | −2.3% | +19.7% | +24.5% | n/a |
| Below 10 | |||||
| 01/03/2017 | 8.0 | −0.9% | −1.0% | −4.4% | −17.9% |
| 11/07/2017 | 5.1 | −1.0% | +5.6% | +0.2% | +16.4% |
The result is mixed, and we say so plainly:
- Above 90 works on a longer horizon. After 4 weeks the average change is −0.3% versus +1.4% for all weeks, and 6 of 8 signals are negative. After 8 weeks the average is +4.1% (7 of 8 positive), and after 13 weeks +8.9% versus +4.3% for all weeks. Crude usually falls a little further first and only then turns.
- The only clear failure is October 2022. Two weeks after the OPEC+ decision to cut output by 2 million barrels per day, the price fell 9.3% over 8 weeks amid China's lockdowns and recession fears.
- Below 10 has no statistics. Both signals are from 2017 and gave a minimal decline after 4 weeks. The longest period below 10 (November 2017 to March 2018) coincided with a rally, not a top.
For comparison, the average change for all weeks is +1.4% over 4 weeks, +2.9% over 8, +4.3% over 13 and +7.3% over 26 weeks. The sample is small: 8 signals above 90 and 2 below 10 in 10 years. On top of that, the above-90 zone is strongly affected by the structural shift described above. This is context for a decision, not a statistically proven system.
Seasonality in these periods
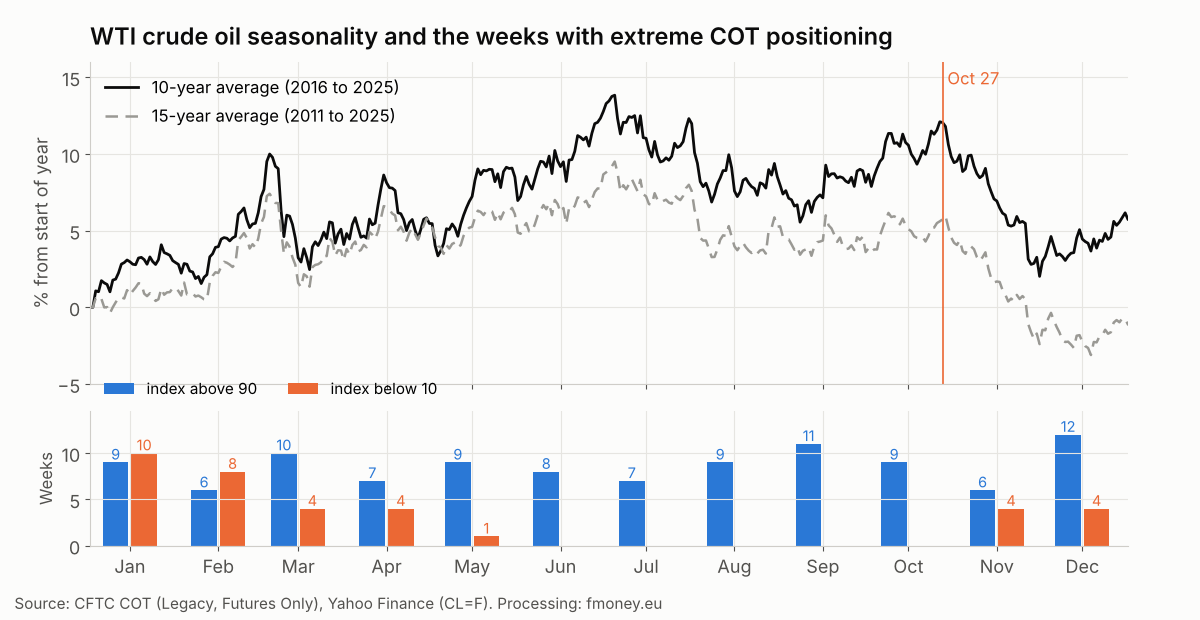
The average seasonal curve for the last 10 years (2016 to 2025) has two peaks and a weak end of the year:
- January to early March: a rise to about +10% around March 5, then a pullback to about +2.5% in mid-March;
- April to early July: a climb to the high of the year around July 4 (about +14%), as the US driving season begins;
- July to early September: a decline to about +6%;
- September to late October: a second peak around October 26 (about +12%);
- November: the weakest month, falling to about +2% at the end of November, with a modest recovery to about +6% by year end.
The 15-year curve has the same shape, peaking around July 4 (about +9.5%) and ending the year at about −1%.
Weeks above 90 are spread across the whole year (6 to 12 weeks per month), because the structural trend matters more than the season here. Weeks below 10 fall between November and May.
Today we are at the autumn seasonal peak. Comparing the October 27 close with the end of December for each of the last 10 years, the price ended lower in 6 of 10 years. The median is −3.9% and the mean is −3.6%.
Where we are now
According to CFTC data as of October 20, 2026:
- Commercials net position: −116,158 contracts (COT Index 78.4);
- 4-week change: Commercials have reduced their net short by 53,731 contracts;
- Managed Money net position: +36,187 contracts (156-week index 25.5), down from +111,731 on September 8;
- open interest: 1,835,144 contracts.
This is the most interesting detail. Crude is around $100, yet the funds have been cutting their longs for six straight weeks. We saw a similar picture in 2022: during the war in Ukraine, crude was above $100, funds were leaving the market because of high volatility, and the Commercials index stayed above 90 for 30 weeks while the price fell from $122 to $77.
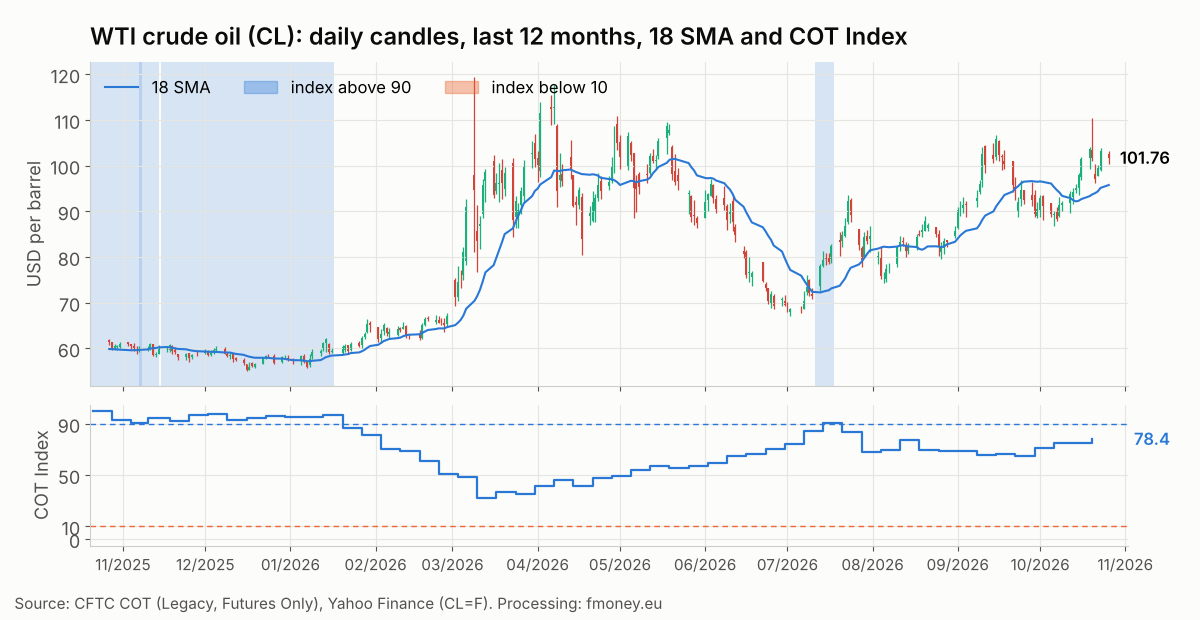
The daily chart shows the full cycle of the war. From the 12-month low ($55.27 on December 16, 2025), crude jumped above $110 after the strikes on Iran in early March 2026. After the ceasefire agreement in mid-June the price fell below $70, and after new clashes in August and September it climbed back above $100. Today's close is $101.76, 19% above the 200-day average and above the 18-day average ($95.77).
The three frameworks currently say:
- COT: the index is 78.4 and rising, but not in an extreme zone. No signal under our filter.
- Seasonality: we are at the autumn seasonal peak. In 6 of 10 years the price was lower by the end of December.
- Price: an uptrend, above both averages, driven by a geopolitical risk premium.
The scenario we are watching: if the index moves above 90 with the price near $100, it would resemble 2022 more than the 2023 to 2025 signals, which came after a drop below the 200-day average. In wartime, news from the Strait of Hormuz decides, not positioning.
5 mistakes when working with COT extremes in crude oil
- Ignoring the structural trend. The Commercials net short has been shrinking since 2018 because the funds buy less and less. An index above 90 today does not mean the same as in 2017.
- Entering in the very first week. Signals above 90 averaged −0.3% over 4 weeks. Wait for price to confirm the turn.
- Reading an index below 10 as a sell signal. In 2017 and 2018 the record short of producers came in the middle of a rally.
- Looking for a COT signal in a geopolitical shock. At the March 2026 top the index was 32; at the June 2022 top it was 93. War and ceasefire move the price, not positioning.
- Large size on a small sample. 10 signals in 10 years are not statistics. Use the risk calculator and check open interest.
How we use it in practice
In our strategy, Commercials positioning is a mandatory filter: we do not look for longs when commercial traders are at an extreme short, and vice versa. In crude oil the filter is currently neutral, seasonality is at its autumn peak, and the trend is strong but depends on the war. Without a COT extreme, entry comes only from price structure and risk management.
Frequently asked questions
How many times has the crude oil COT Index been above 90 in 10 years?
103 weeks out of 522, in 16 separate periods. The longest ran from March 15 to October 4, 2022 (30 weeks).
How many times has it been below 10?
35 weeks in 3 periods, all between January 2017 and May 2018. The longest ran from November 7, 2017 to March 6, 2018 (18 weeks).
Why has the index not fallen below 10 since 2018?
Because the Commercials net short has been shrinking almost without interruption since the January 2018 record. Funds hold far fewer longs than before, so producers have fewer buyers on the other side of their hedges.
How did you calculate prices and seasonality?
We use the continuous front month CL=F, back-adjusted on the day after each expiry. For April 2020 we use June contract prices instead of the negative May prices. The charts show the actual front-month price in dollars per barrel.
Is this a signal to buy or sell crude oil now?
No. This is an analysis of historical data. The COT Index is neutral, seasonality is at its autumn peak, and entry should always come from price and your own risk management.
Conclusion
Over 10 years, Commercials in crude oil were at an extreme in about 26% of weeks, but almost all of those weeks point the same way within a given period: below 10 until 2018 and above 90 after 2022. The above-90 zone led to higher prices after 8 and 13 weeks in 7 of 8 cases, usually after a further dip in the first month. The only clear failure (October 2022) came with a drop in demand. Today crude is above $100 because of the war, and commercial traders are close to the above-90 zone without being in it. Positioning gives no edge for now; the risk comes from the news.
You can follow the current COT Index for crude oil and dozens of other markets in our free demo; weekly analyses and the full toolset are available in our membership plans.
Sources: CFTC Commitments of Traders (Legacy and Disaggregated, Futures Only), data as of 10/20/2026; Yahoo Finance (CL=F), prices as of 10/26/2026. Calculations: fmoney.eu. Trading futures involves a high risk of loss. This content is for educational purposes and is not investment advice. Past performance does not guarantee future results.