The COT Edge Weekly, Nov 8, 2026: Metals, Energy, Yen, Cattle
The COT Edge Weekly by Svilen Dimitrov, fmoney.eu. Prices are Friday closes (November 6, 2026). COT data is the CFTC report of Tuesday, November 3, 2026, released on Friday. This is research, not trading advice.
Every Sunday The COT Edge Weekly does two things. First, it boils the week in futures down to what matters. Second, it takes the markets on the fmoney.eu "Markets in focus" list and asks one question for each: are the commercial hedgers, the people who produce and use the physical commodity, positioned against the crowd, and does anything else agree with them?
This week the list is long: crude oil, natural gas, heating oil, platinum, silver, copper, gold, the Japanese yen and live cattle. Eight of the nine carry a COT buy signal, the yen carries a sell. That does not mean nine trades. For each market you get a direction, a zone of interest and a zone where the idea is wrong. No entries, no stops, no position sizes.
At a glance: 5 things
- Oil lost its war premium fast. WTI fell 12.8% for the week to $90.83 and Brent 16.4% to $98.32 on hopes of a US and Iran deal that would reopen the Strait of Hormuz. Diplomacy, not data, sets the direction now.
- Stocks had their worst week since June. The S&P 500 lost 2.7% and the Nasdaq 3.4% after a Thursday sell off in chip and data center names. Payrolls came in at +165,000 against roughly 65,000 to 70,000 expected, which keeps a December 9 Fed hike on the table.
- Precious metals bounced from deep lows. Gold gained 4.5% for the week, silver 5.8%, platinum 7.0%. Commercial hedgers in silver and platinum are at the top of their 6 month and 1 year ranges.
- Cattle broke down, but the hedgers are buying. December live cattle fell 4.4% to 214.05 and printed a new low at 210.85 on Friday before closing in the upper third of the day. Large speculators are almost as short as they have been in three years.
- Coffee showed a news failure. Bearish news (ICE stocks of Brazilian coffee at a 9 month high, a weak real) met a crowd that was already short. Price made a new low on Friday and then closed up 1.0%. That is the kind of reaction the COT method watches for.
The week in futures
Energy
The Iran war premium is melting. Iran is studying a Qatari proposal and has offered to reopen Hormuz within two days in exchange for sanctions relief. On Friday WTI closed at $90.83, Brent at $98.32, RBOB gasoline at $2.777 (down 16.2% for the week) and heating oil at $4.332 (down 9.6%). US distillate stocks are the lowest since 2003, so the diesel crack is still near the top of its range. Natural gas went the other way: up 3.5% to $2.998, with commercial hedgers at a 3 year COT index of 100 and money managers at 0.
Metals
Gold had its best week in more than two months before Friday's stronger dollar (DXY 102.3) and strong payrolls took about 1% off. December gold closed at $4,075, silver at $51.94, copper at $6.238 and platinum at $1,538. Copper sits right on its 200 day average and is lagging the precious metals.
Grains and oilseeds
Harvest pressure, cheaper crude and a weak Brazilian real kept the complex heavy. January soybeans made a new 7 week low before a bounce, soybean oil lost 5.5% for the week and is 8.8% below its 200 day average. The COT filter allows only shorts in soybeans and soybean meal and only longs in Chicago wheat.
Softs and meats
Sugar keeps sliding under a heavy fund long (money manager index 91.9). Cocoa lost 5.5% for the week. Lean hogs made new contract lows with funds at maximum short, and so far the news still confirms the crowd. Live cattle is covered in depth below.
Stock indices and rates
S&P 500 7,376.86, Nasdaq Composite 24,579.42, Dow 51,285.73, Russell 2000 2,754.11. The 10 year yield ended at 4.859% and the VIX at 25.64. The COT report is from Tuesday, before Thursday's sell off.
Calendar for the week of November 9
- Monday, November 9: USDA Crop Progress and Export Inspections.
- Tuesday, November 10: US CPI for October. The most important number of the week for the Fed and for metals.
- November 10 to 11: US hosted Ukraine and Russia talks in Abu Dhabi.
- Wednesday, November 11: Veterans Day, bond market closed, EIA reports may shift.
- Thursday, November 12: EIA natural gas storage, USDA Export Sales.
- Friday, November 13: US PPI and the new COT report.
- Any day: the US decision on Iran (strikes, pressure or a deal).
- December 9: Fed decision.
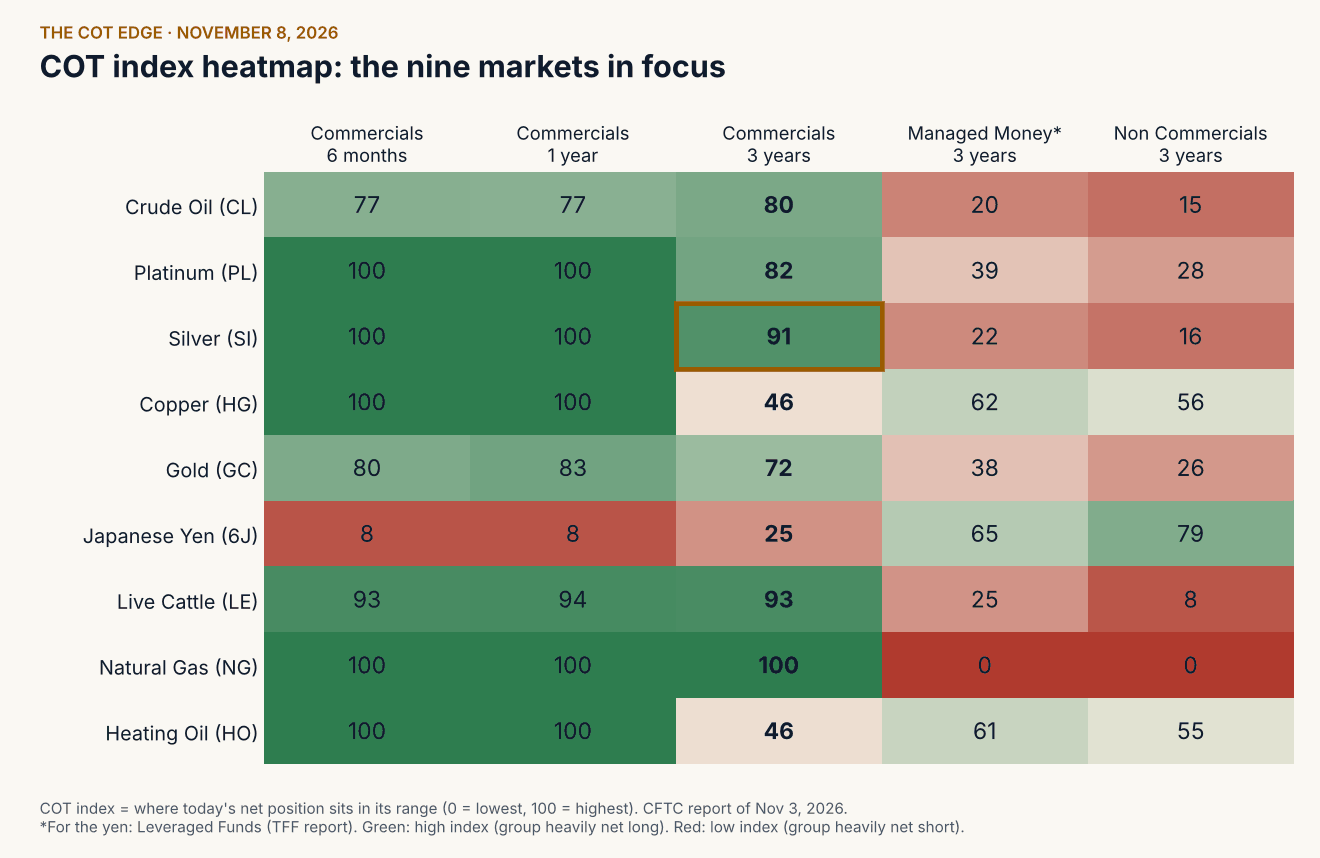
In the deep dive below: all nine markets from this week's "Markets in focus" list. The short version: bullish on silver, platinum, gold, live cattle and natural gas; neutral with a mild bullish tilt on copper; neutral on crude oil and heating oil; neutral with a mild bearish tilt on the yen.
Deep dive: direction and zones
How to read this section. The COT index shows where a group's net position sits inside its own range over a period: 100 is the most net long, 0 the most net short. Commercials are the hedgers. My filter uses the 3 year index: 60 or more allows only longs, 40 or less only shorts, in between is neutral. The zone of interest is where the idea has the best risk to reward. The invalidation line is a weekly close that says the idea is wrong. The confirmation line is where price would agree with the hedgers.
1. Silver (SI): bullish, medium confidence
Bottom line. Commercial hedgers have bought silver to the top of their 6 month and 1 year ranges while funds sit near the bottom of theirs, and price is 25.6% below its 200 day average after a fall from above $115 in January. The cleanest COT picture on the list, but the Fed and long yields still have the final word.
Macro picture. In 2026 silver has traded with long term yields and the oil price that feeds them more than with its supply deficit. The Fed hiked in September to 3.75% to 4.00% and markets price roughly 75% to 80% odds of another hike on December 9. Strong payrolls on Friday did not help. The bullish path runs through a deal with Iran: cheaper oil means less energy inflation, fewer hikes and lower yields. Saxo's Ole Hansen has warned that further fund selling could push silver toward the mid $40s, so the downside case is real.
COT. Commercials net short 34,756 contracts, 6,836 fewer than four weeks ago. Index 100 (6 months), 100 (1 year), 91 (3 years). Money managers net long only 4,035, index 22.3; non commercials 16.1. The filter allows longs only. Open interest rose 10,453 in four weeks while hedgers covered, which suggests new shorts from speculators rather than fresh hedging.
Seasonality. From early November to the end of January silver rose in 7 of the last 10 years, average +8.7%. Over 15 years it is weaker: 8 of 15, average +5.2%. Supportive, not decisive.
Futures curve. Normal contango: December $51.94, March $52.57, July $53.47. That is roughly the cost of carry, no sign of physical stress in New York.
Chart and zones. Zone of interest $47.80 to $50.50 (the 52 week low and the October low area). Confirmation: a close back above the 18 day average, near $54. Invalidation: a weekly close below $46.
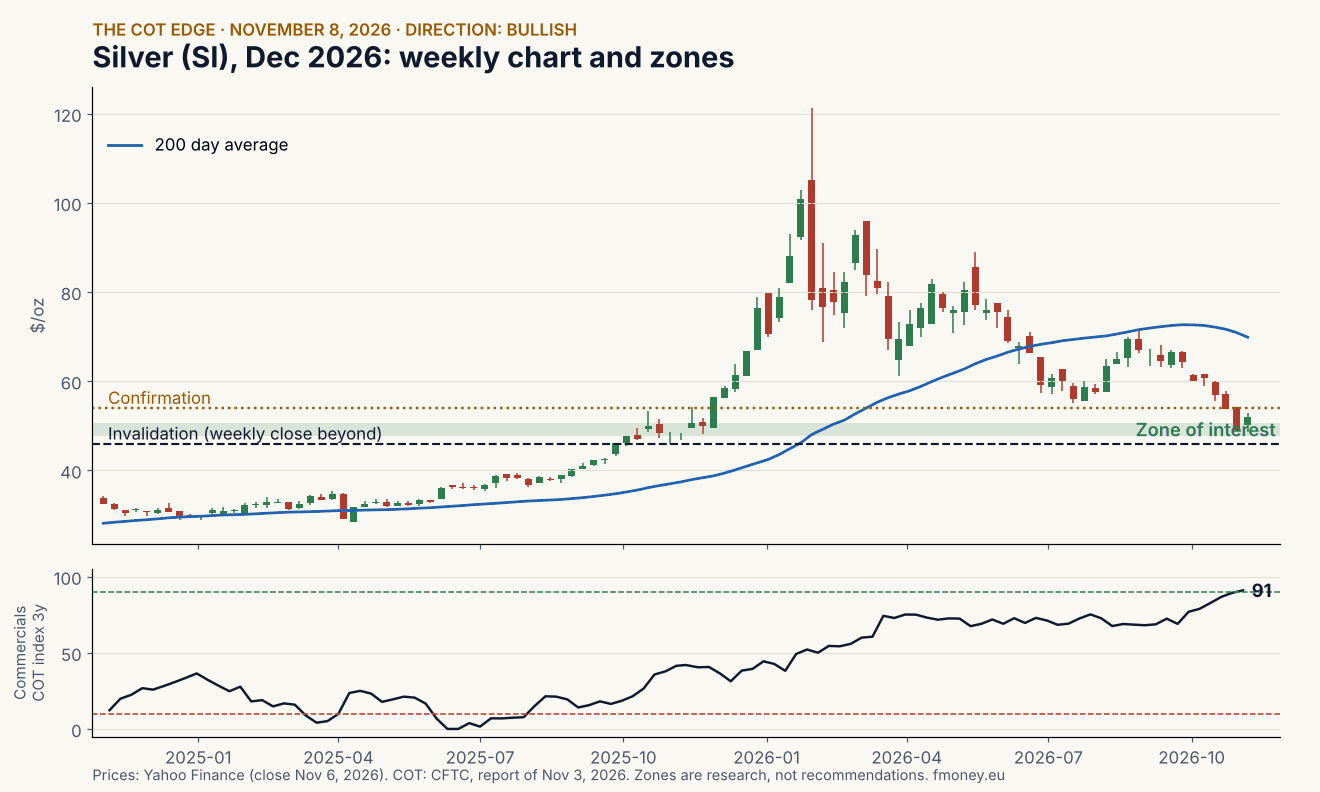
What would change my mind. A hot CPI on November 10 that pushes December hike odds toward certainty, a collapse of the Iran talks that sends oil back above $100, or a weekly close below $46 with funds adding shorts.
2. Platinum (PL): bullish, medium confidence
Bottom line. Same COT pattern as silver, with a stronger bounce: +7.0% last week from a new 52 week low. Hedgers are at the top of their 1 year range and open interest is rising fast. The structural deficit story has faded, which is exactly why positioning is clean.
Macro picture. The World Platinum Investment Council now expects a small surplus of 265,000 ounces for 2026 after earlier deficit forecasts, because investors sold metal in the first half. It still sees a deficit of 283,000 ounces in the second half. Lease rates fell and the London market moved from backwardation into slight contango, so the squeeze of 2025 is gone. Platinum also shares silver's sensitivity to rates and the dollar.
COT. Commercials net short 9,256, 8,530 fewer than four weeks ago. Index 100 / 100 / 82. Money managers net short 1,283 after selling 9,758 contracts in four weeks, index 38.6. Open interest jumped by 25,410 to 91,278 in four weeks. Filter: longs only.
Seasonality. Early November to end of January: up in 7 of 10 years, average +7.1%; 9 of 15 years, average +4.4%.
Futures curve. Mild contango: January $1,536.90, April $1,553.50, July $1,570.10. Consistent with a market that is no longer short of metal in the near term.
Chart and zones. On the January contract: zone of interest $1,390 to $1,480 (the recent low at $1,388.90). Confirmation: a close above the 18 day average near $1,555. Invalidation: a weekly close below $1,360.
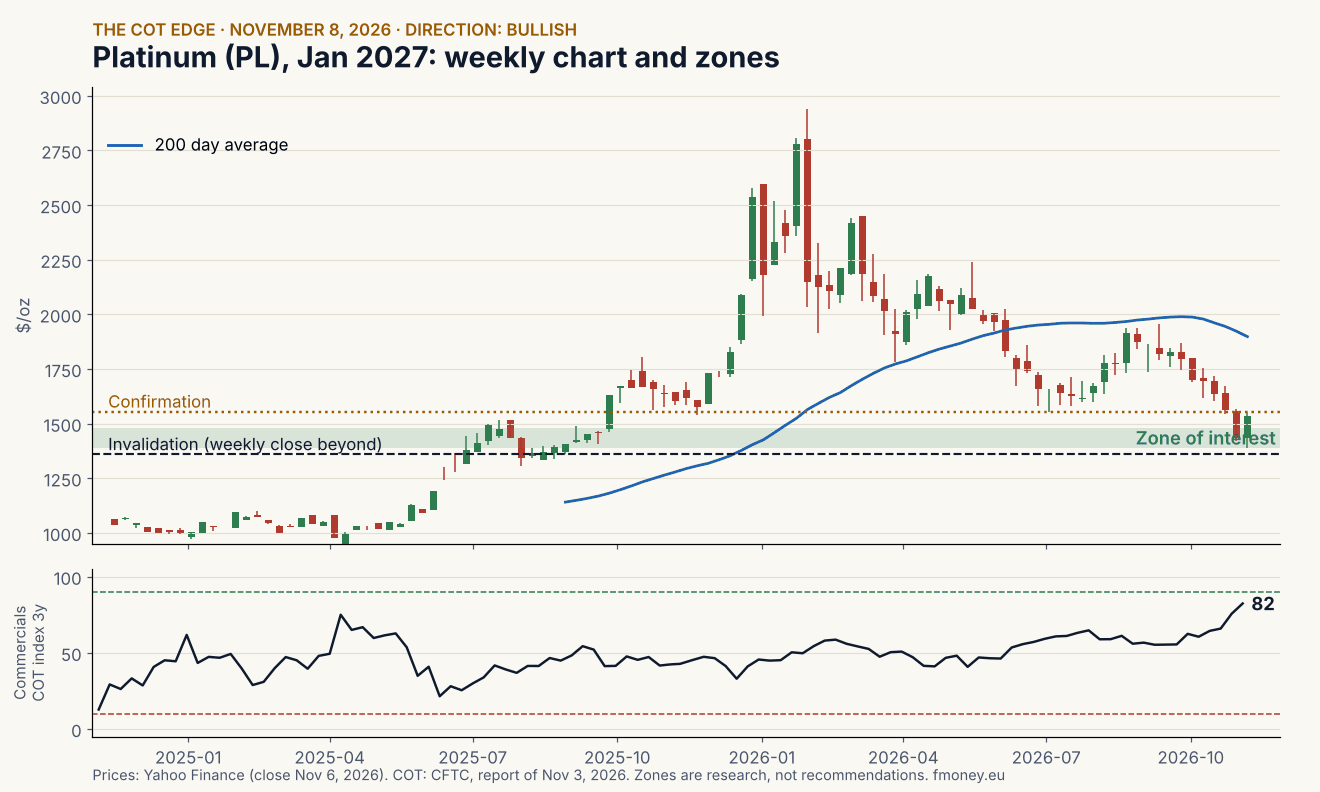
What would change my mind. Fresh ETF outflows, a stronger dollar after CPI, or a weekly close below $1,360.
3. Gold (GC): bullish, low to medium confidence
Bottom line. Gold is 9.5% below its 200 day average after a fall from $5,318, commercials are in the upper part of their ranges and central banks keep buying. The signal is supportive but not extreme, so gold is the steadier, weaker cousin of the silver idea.
Macro picture. Central bank buying is at a record pace for 2026. Against that: Indian demand fell 29% in the third quarter according to the World Gold Council, and the Fed may hike again in December. Gold reacts to the same Iran and rates story as silver, but with less leverage.
COT. Commercials net short 204,902, 39,625 fewer than four weeks ago. Index 80 / 83 / 72. Money managers net long 103,614, index 37.6. Filter: longs only.
Seasonality. Early November to end of January: up in 7 of 10 years, average +4.7%; 9 of 15, average +3.4%.
Futures curve. Normal carry: December $4,074.90, February $4,107.50, June $4,173.60.
Chart and zones. Zone of interest $3,880 to $3,980 (the October low). Price already sits on its 18 day average, so confirmation is a weekly close above the 4 week high near $4,240. Invalidation: a weekly close below $3,800.
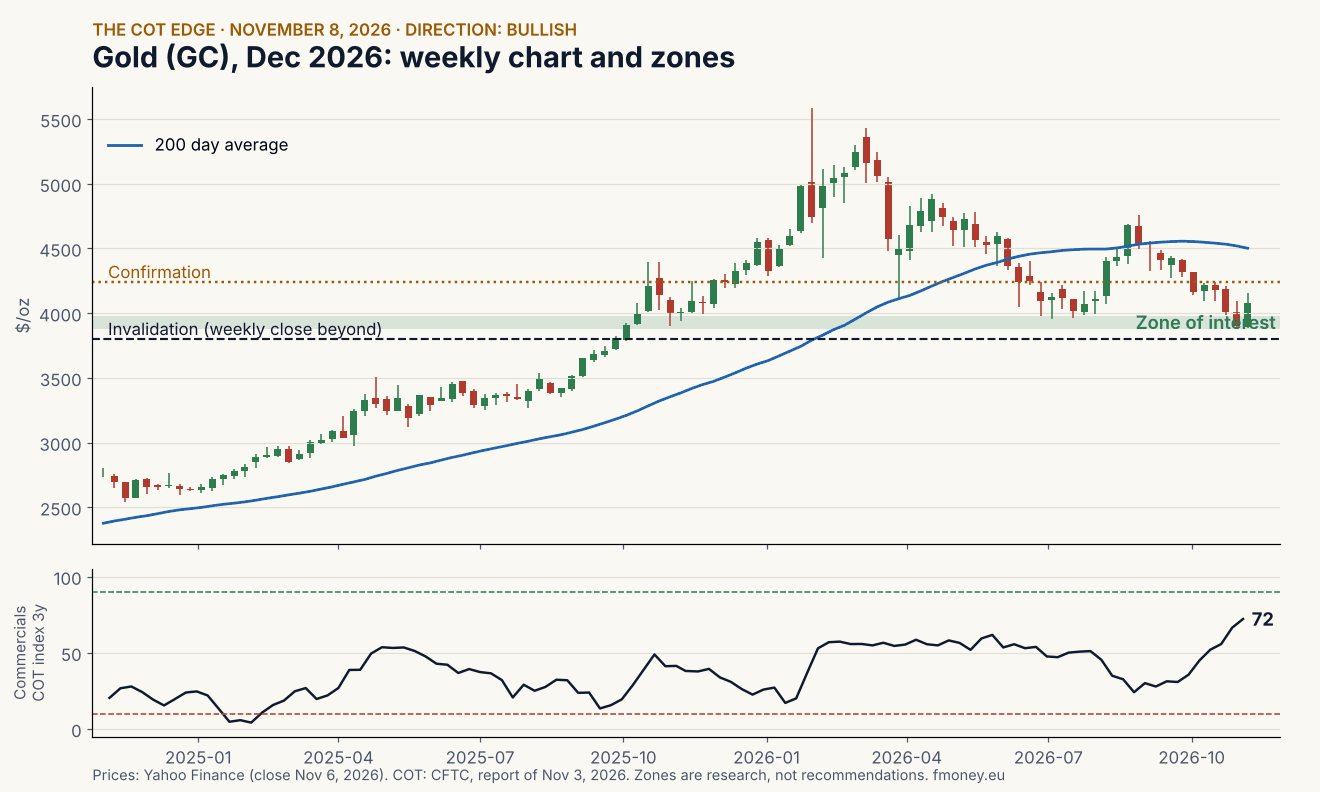
What would change my mind. A hawkish CPI surprise, the dollar index pushing well above 103, or a weekly close below $3,800.
4. Live cattle (LE): bullish, medium confidence
Bottom line. The hedgers are near the top of all three ranges, large speculators are almost as short as in three years, price just made a new low and closed in the upper third of the day, and the season is on the bulls' side. The risk is that cash cattle keep falling.
Macro picture. Futures followed cash lower: cash trades fell about $7 to $216 to $217. Supply from Mexico is a new factor after the Columbus, New Mexico port reopened to live cattle imports in late October. Beef demand has held up, but packers have regained leverage. The next big report is Cattle on Feed around November 20.
COT. Commercials net short 23,839, index 93 / 94 / 93. Money managers net long 49,691, index 25.3. Non commercials index 8.0, close to a 3 year low. Filter: longs only.
Seasonality. Early November to year end: up in 8 of 10 years, average +4.5%; 12 of 15 years, average +3.3%. The strongest seasonal record on the list (continuous front month, so contract rolls add some noise).
Futures curve. December 214.05, February 217.20, April 219.85, then June 215.28 and August 211.15. A premium into spring and a discount into summer is the normal seasonal shape. Spring contracts price higher cash ahead.
Chart and zones. On the December contract: zone of interest 207 to 212 (Friday's low at 210.85). Confirmation: a close above the falling 18 day average, near 225. Invalidation: a weekly close below 205.
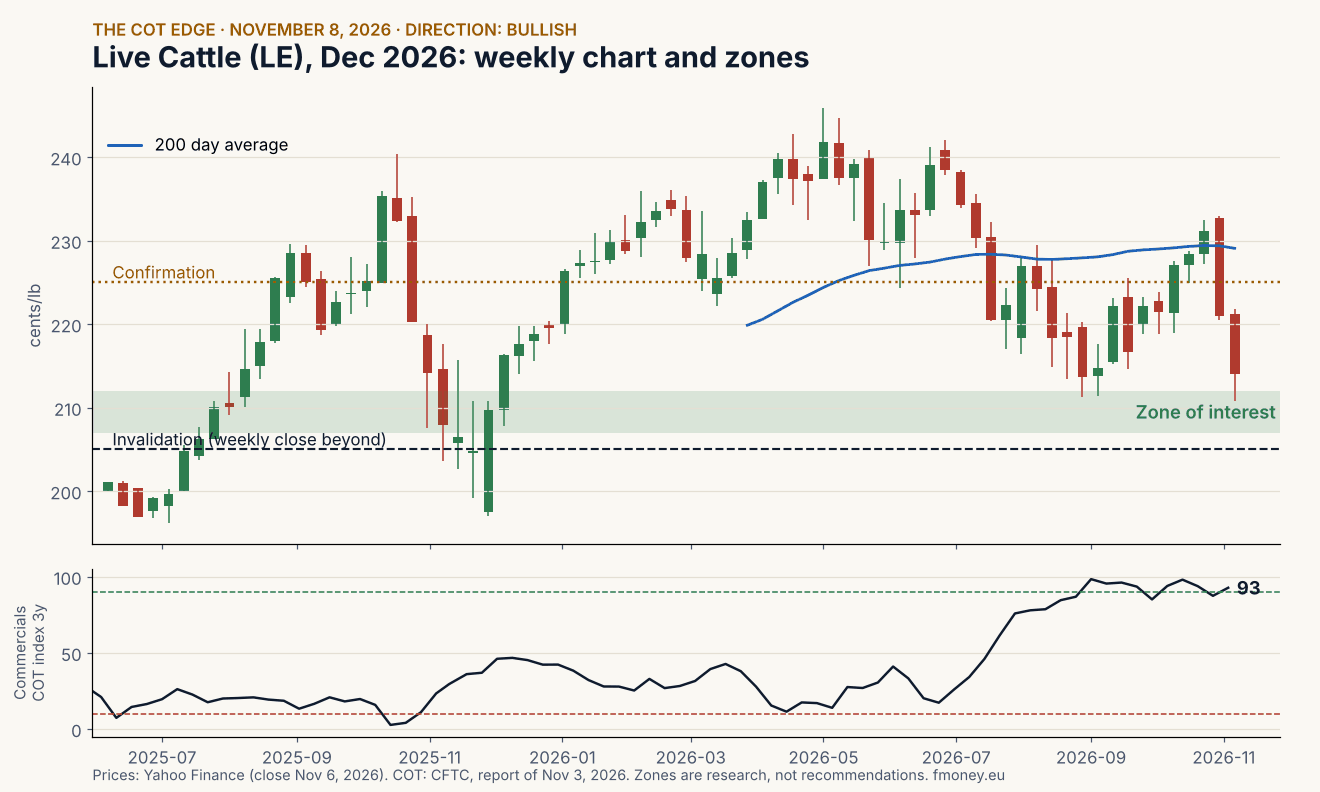
What would change my mind. Another week of lower cash bids, a bearish Cattle on Feed report or larger Mexican imports, and a weekly close below 205.
5. Copper (HG): neutral with a mild bullish tilt, low confidence
Bottom line. Hedgers bought fast and sit at the top of their 6 month and 1 year ranges, but only at 46 on the 3 year index, so my filter says neutral. Seasonality and Chinese physical demand lean bullish; price has not confirmed.
Macro picture. Chinese spot premiums for copper cathode set records last week and the Yangshan bill of lading premium hit a new high, a sign of real demand for prompt metal. More than 70% of LME copper stocks are held in US warehouses, a leftover of the tariff trade, and a 15% US tariff on refined copper is still proposed for January 2027. Against that: weaker equities and a firmer dollar.
COT. Commercials net short 41,923, 36,000 fewer than four weeks ago. Index 100 / 100 / 46. Money managers net long 34,890 after selling 26,244 in four weeks, index 62.3. Filter: neutral.
Seasonality. Early November to end of January: up in 8 of 10 years, average +7.0%; 10 of 15, average +3.9%.
Futures curve. Contango: December $6.238, March $6.338, July $6.462. Ample exchange supply in the US.
Chart and zones. Zone of interest $6.05 to $6.20 (the 200 day average and the 13 week low). Confirmation: a close above the 18 day average near $6.49. Invalidation: a weekly close below $5.95.
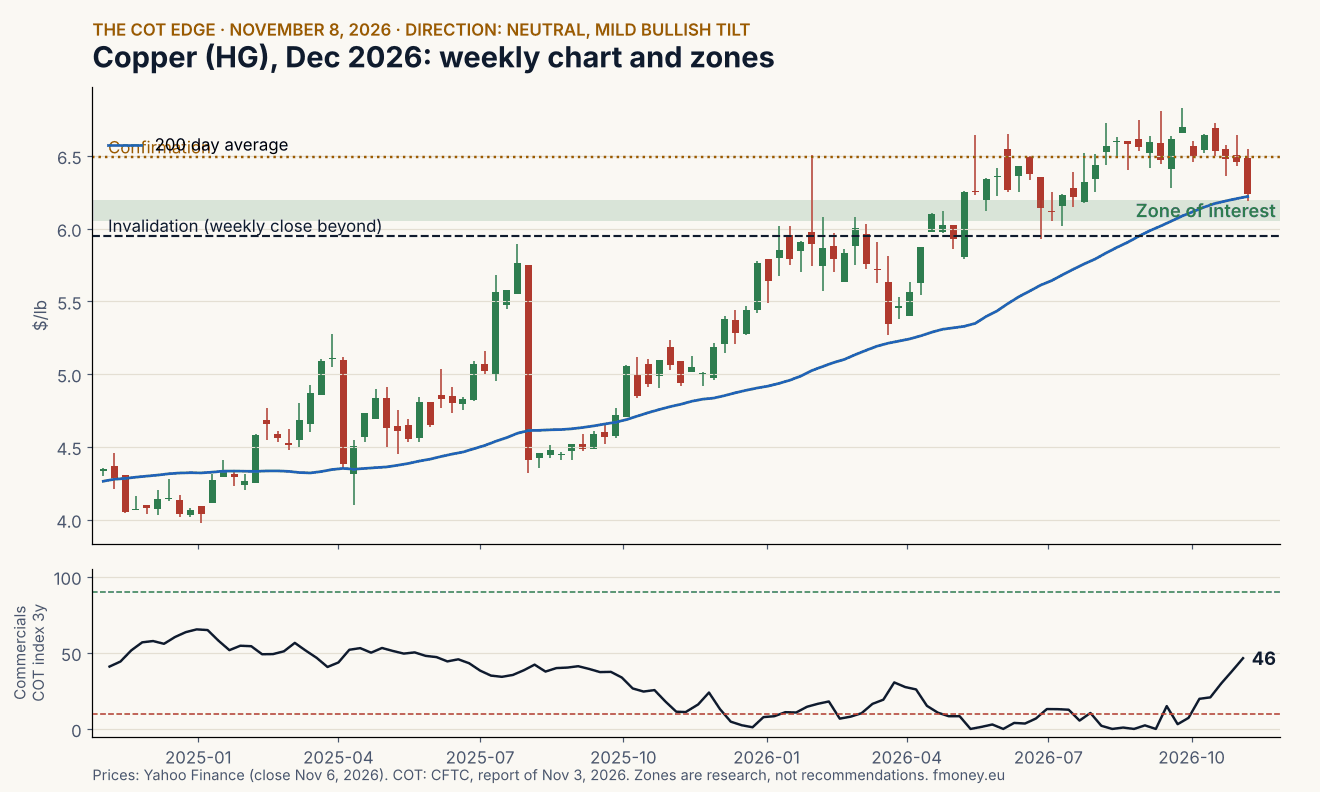
What would change my mind. For a stronger bullish view: the 3 year index above 60 and a close above $6.49. For the bearish side: a demand shock (tariffs, recession fears) and a weekly close below $5.95.
6. Crude oil (CL): neutral, low confidence
Bottom line. The COT buy signal is real (commercials 80, funds 20.5) but not extreme, and price is still 4.2% above its 200 day average. In my 10 year study of WTI, the war tops were set by diplomacy, not by positioning. That is the situation now.
Macro picture. The market is pricing a deal: an end to the US blockade of Iranian ports and a waiver on Iranian oil sales in exchange for reopening Hormuz. Talks have stalled before, and Washington keeps strikes on the table. EIA data show a crude build in the last week of October, while product stocks remain tight.
COT. Commercials net short 111,277, index 77 / 77 / 80. Money managers net long 21,728 after selling 31,870 in four weeks, index 20.5; non commercials 15.2. Filter: longs only. In past WTI cases the best buy signals came with price 5% to 15% below the 200 day average and a supply shock after the signal. Neither is in place yet.
Seasonality. Early November to end of January: up in 6 of 10 years, average +5.0%; 9 of 15, average +0.3%. No edge.
Futures curve. Steep backwardation: December $90.83, June 2027 $81.95, December 2027 $75.58, a 16.8% discount one year out. The market expects the shortage to end; a deal would likely flatten the front.
Chart and zones. Zone of interest $84 to $87.50 (the 200 day average and the October low at $86.65). Confirmation: a close back above the 18 day average near $98.50. Invalidation: a weekly close below $80.
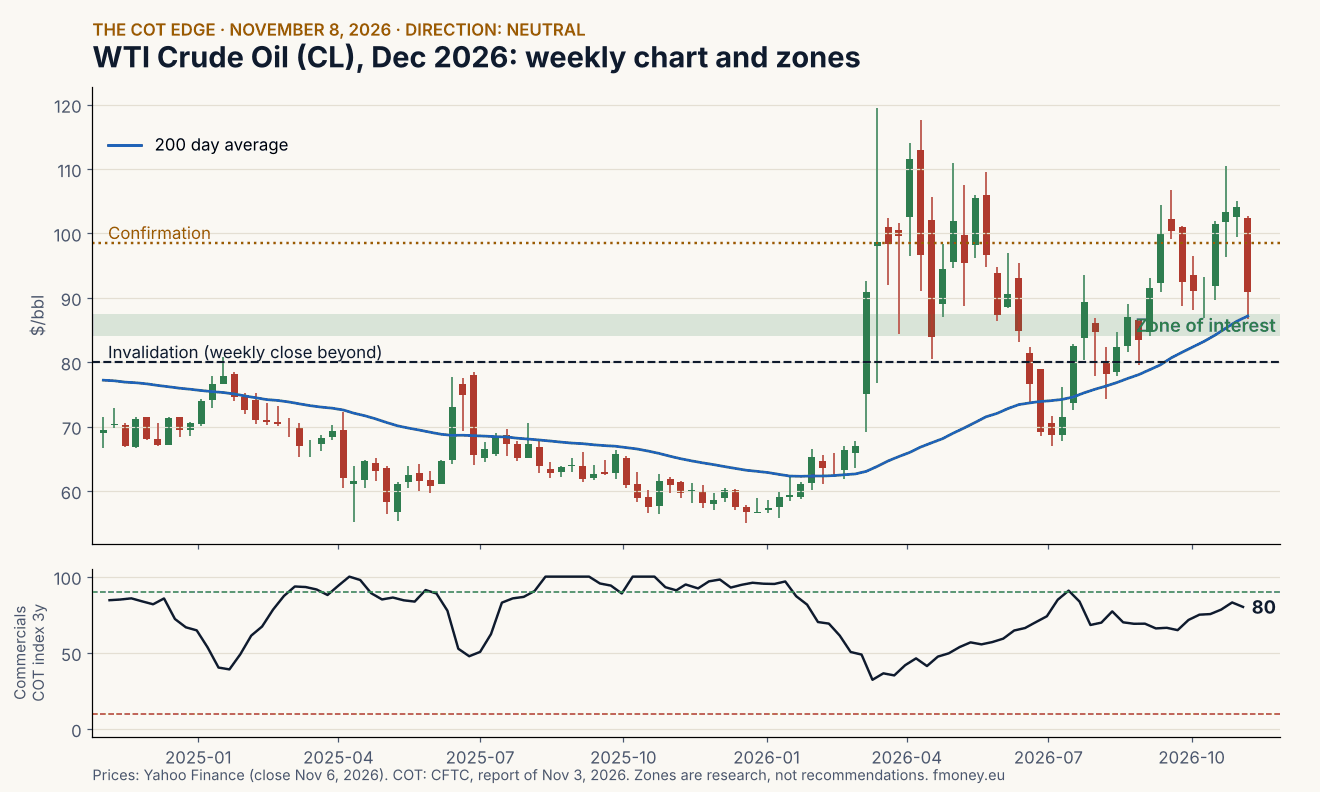
What would change my mind. A signed deal with ships moving through Hormuz (bearish, the $80 line would likely give way). Collapse of the talks or new strikes (bullish, a fast move back toward $100).
7. Japanese yen (6J): neutral with a mild bearish tilt, low confidence
Bottom line. Commercials are at the bottom of their 6 month and 1 year ranges and speculators lean long, which points lower for the yen. But the downside runs into the line where Tokyo intervened before, so the risk to reward is poor.
Macro picture. The Bank of Japan held at 1.25% in October but said underlying inflation has reached its 2% target, which opens the door to a December hike. Tokyo keeps issuing verbal warnings near 158 per dollar. The Fed may hike on December 9 as well, so the rate gap may not narrow. Safe haven flows during equity sell offs have helped the yen.
COT. Commercials net short 103,167 after adding 41,418 shorts in four weeks, index 8 / 8 / 25. Leveraged funds net short 14,817 but bought 10,226 in four weeks, index 65.4. Non commercials 78.8. Filter (3 year 25): shorts only.
Seasonality. No edge: up in 5 of 10 years from early November to end of January, average +1.2%; 7 of 15, average −0.1%.
Futures curve. December 63.13 and March 63.75 cents per 100 yen. The premium reflects the interest rate gap, not supply and demand.
Chart and zones. Futures quote the yen in US cents per 100 yen (63.13 is about 158.4 per dollar). Zone of interest for a short idea: 63.80 to 64.20 (about 156 to 157 per dollar). Invalidation: a weekly close above 65.00 (about 154 per dollar). Downside is capped around 62.50, which is 160 per dollar, the intervention zone.
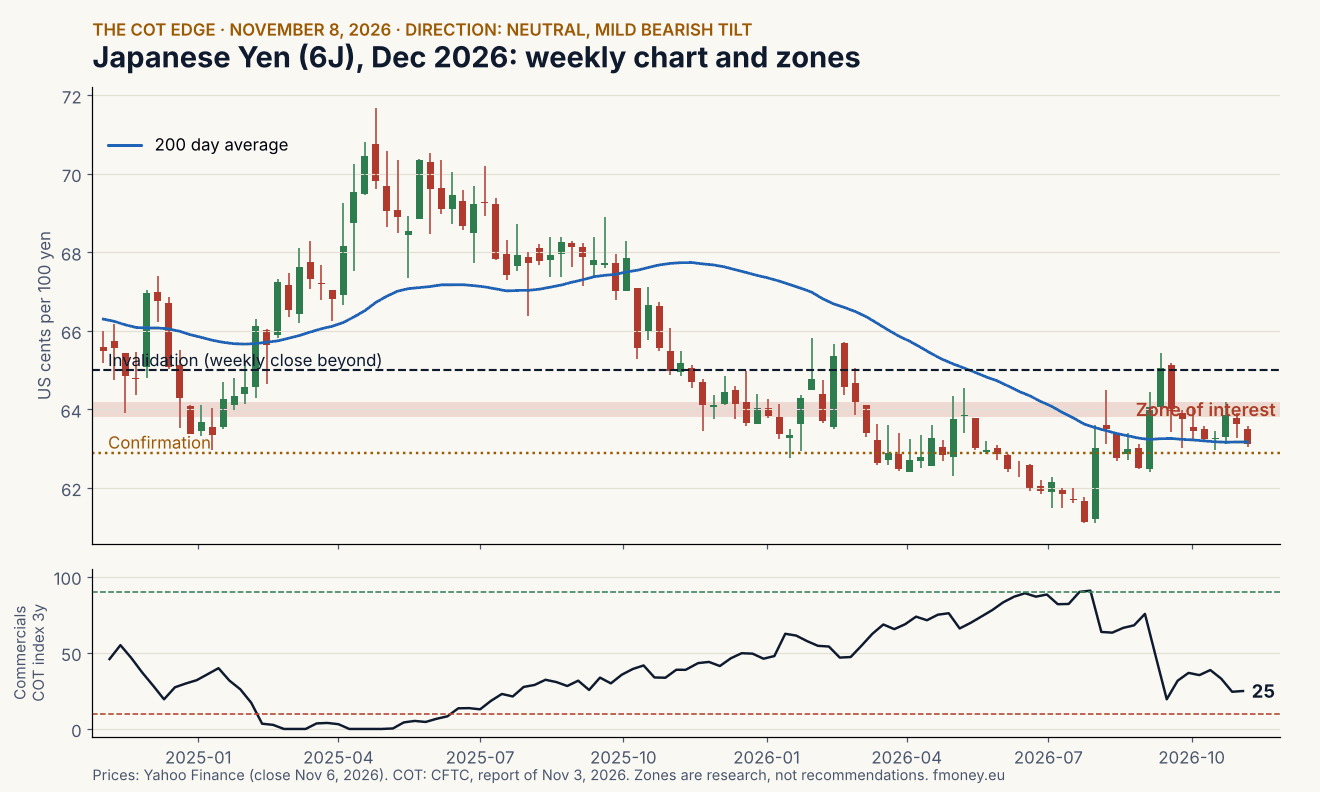
What would change my mind. A clear BOJ signal for December plus a softer US CPI, a deeper equity sell off with haven buying, or a weekly close above 65.00.
8. Natural gas (NG): bullish, medium confidence
Bottom line. The most extreme reading on the list: commercials at 100 on all three ranges, money managers and non commercials at 0. It comes at the time of year when this signal has worked before. Seasonality is against it and the January contract has not confirmed yet.
Macro picture. Gas closed above $3.00 on Friday. US storage is only about 1.4% above normal, production has eased, but warm weather forecasts are capping the rally. In my 10 year case study of natural gas, a commercials index above 90 worked only in late October and November, before the heating season (2024 and 2025). It failed when storage was 9% to 23% above the 5 year average; today's surplus is far below that. The missing piece is a new source of demand: a cold forecast, a surprise storage draw or record LNG feedgas.
COT. Commercials net long 243,049 contracts, 23,202 more than four weeks ago. Index 100 / 100 / 100. Money managers net short 225,359 after selling another 80,822 in four weeks, index 0; non commercials 0. Open interest fell 137,436 in four weeks. Filter: longs only.
Seasonality. Against the idea. On the continuous front month, early November to end of January was lower in 8 of 10 years, average −15.3%, and lower in 12 of 15 years. Contract rolls blur this series, which is why the zones below use the January contract.
Futures curve. Extreme winter shape: December $2.998, January $3.454, then March $2.410 and April $2.358. January carries a 15% premium over December and a 30% premium over March. A long in January pays for the winter premium up front; if the cold does not arrive, that premium melts.
Chart and zones. On the January contract: zone of interest $3.30 to $3.45 (the recent low at $3.313). The December contract already closed above its 18 day average; January has not, so confirmation is a close above about $3.56. Invalidation: a weekly close below $3.20.
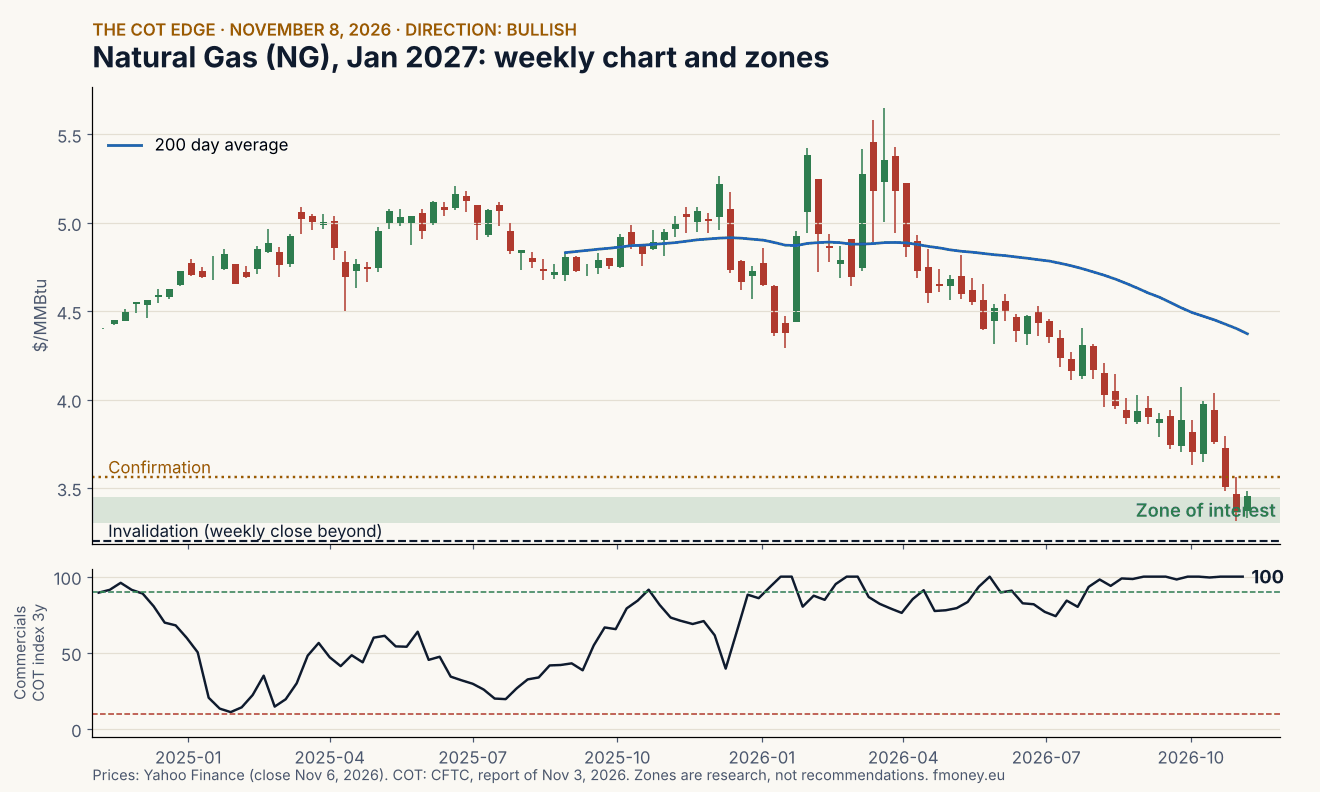
What would change my mind. A large storage injection in the EIA report on November 12, NOAA 6 to 10 and 8 to 14 day outlooks staying warm, or a weekly close below $3.20.
9. Heating oil (HO): neutral, low confidence
Bottom line. Hedgers are at the top of their 6 month and 1 year ranges, but only at 46 on the 3 year index. Diesel stocks are the tightest since 2003, yet the crack spread is near a record and crude is losing its war premium. Two strong forces pull in opposite directions.
Macro picture. US distillate stocks are at 99.3 million barrels, the lowest since 2003, and the heating oil crack (HO times 42 minus WTI) is about $91 per barrel, in the 94th percentile. My 10 year study of heating oil says crude comes first: when crude collapses, a buy signal fails, and an extreme crack tends to shrink. A US and Iran deal would hit both crude and the crack. A cold winter or new refinery outages would do the opposite.
COT. Commercials net short 18,646, 11,110 fewer than four weeks ago. Index 100 / 100 / 46. Money managers net long 7,038, index 60.7. Filter: neutral.
Seasonality. Weak and mixed: early November to end of January higher in 6 of 10 years, average +3.7%; 8 of 15 years, average −0.5%.
Futures curve. Steep backwardation: December $4.332, January $4.224, March $4.042, May $3.831, December 2027 $3.383, a 22% discount one year out. The market pays up for diesel now and expects the shortage to ease.
Chart and zones. On the January contract: zone of interest $3.85 to $4.05 (below the recent low at $4.049). Confirmation: a close above the 18 day average near $4.50. Invalidation: a weekly close below $3.70.
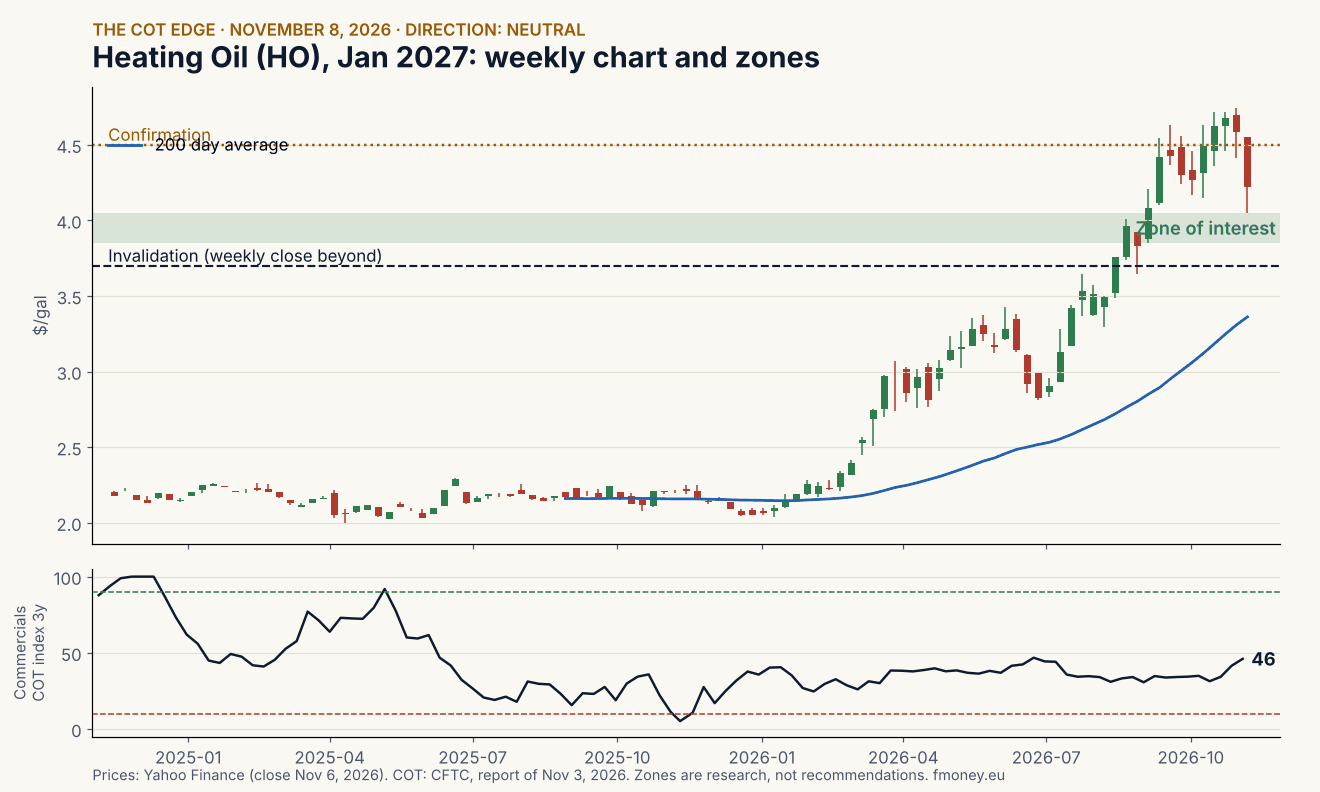
What would change my mind. For a bullish view: the 3 year index above 60, distillate stocks falling further and crude holding up. For a bearish view: a signed Iran deal with the crack shrinking from its current extreme.
Summary
- Silver: bullish, medium. Zone $47.80 to $50.50, invalidation below $46.
- Platinum: bullish, medium. Zone $1,390 to $1,480, invalidation below $1,360.
- Gold: bullish, low to medium. Zone $3,880 to $3,980, invalidation below $3,800.
- Live cattle: bullish, medium. Zone 207 to 212, invalidation below 205.
- Copper: neutral, mild bullish tilt, low. Zone $6.05 to $6.20, invalidation below $5.95.
- Crude oil: neutral, low. Zone $84 to $87.50, invalidation below $80.
- Japanese yen: neutral, mild bearish tilt, low. Zone 63.80 to 64.20, invalidation above 65.00.
- Natural gas (January): bullish, medium. Zone $3.30 to $3.45, invalidation below $3.20.
- Heating oil (January): neutral, low. Zone $3.85 to $4.05, invalidation below $3.70.
The common thread: four of the nine ideas (silver, platinum, gold, and partly copper) depend on the same macro path, cheaper oil and a less hawkish Fed. Treat them as one bet, not four. Crude oil and heating oil hang on the same Iran headline in the other direction.
Want to check the COT index for any futures market yourself? Try the free demo.
Direction and zones are research, not recommendations. No personalized advice. The author manages client capital and may hold positions in the markets discussed. Sources: CFTC Public Reporting, Yahoo Finance, Mansfield Energy, Le Private Banker, Investinglive, Euronews, Trading Economics, Crux Investor, FXStreet, WPIC via Kitco, World Gold Council, USAGOLD, SMM, Argus, Beef Magazine, AP. Trading futures and other financial instruments carries a high risk and is not suitable for everyone. This material is educational and is not investment advice.