Copper COT Index: 10 Years of Extreme Positioning
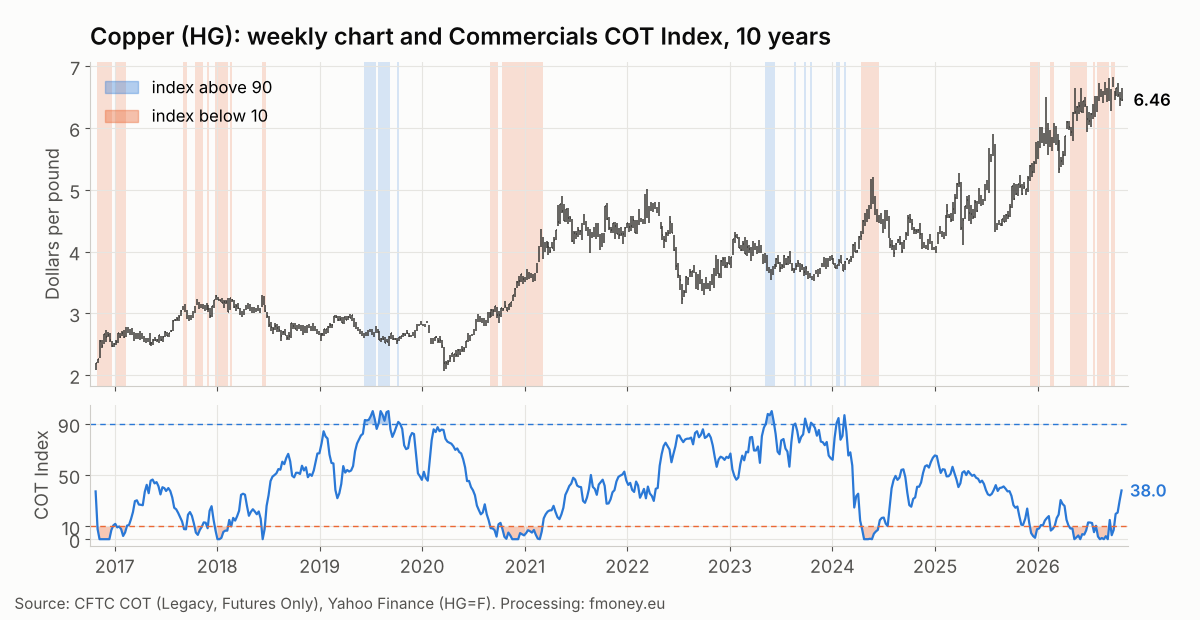
Copper (HG) rallied 38% in ten months, from $4.93 per pound on November 4, 2025 to a record $6.80 on September 9, 2026. One day earlier, Commercials held their largest net short position in ten years. On September 10, reports that the White House plan for tariffs on refined copper had stalled sent the price down 4.9% in a single session. When have Commercials been at an extreme over the past decade, what followed, and what does seasonality say into year end? We checked every week since October 2016.
How we read the Commercials COT Index
The HG copper future trades on COMEX in New York and is quoted in dollars per pound (one metric ton equals 2,204.6 pounds). Commercials here are miners, smelters and refiners, metal merchants and manufacturers of wire and pipe. The CFTC COT report shows their net position (long minus short contracts) every week. The raw number says little on its own, so we put it in context with the COT Index.
COT Index = (current net position − 156 week minimum) / (156 week maximum − 156 week minimum) × 100
An index above 90 means Commercials are near their largest net long (or smallest net short) position of the past three years. An index below 10 means the opposite: they are selling aggressively and are near their largest net short. You can see the index for every market in our free COT demo.
Ten years of copper: how often we are at an extreme
From October 25, 2016 to October 27, 2026 there are 523 weekly COT reports for copper. Of these:
- 24 weeks with the index above 90, in 9 separate periods;
- 89 weeks with the index below 10, in 17 separate periods.
The index spends 78% of the time between 10 and 90. The zone below 10 is almost four times as frequent as the zone above 90, because copper is in a long uptrend and Commercials hedge their sales at ever higher prices. The longest run below 10 lasted 21 weeks, from October 13, 2020 to March 2, 2021, during the post pandemic rally. The longest runs above 90 lasted 6 weeks each, in the summer of 2019.
The two end points are instructive. On September 3, 2019, Commercials held their largest net long of the period, +58,997 contracts. That same day the price made its 2019 low at $2.51. By January 14, 2020 copper had climbed to $2.88 (+14%), before the pandemic drove it down to $2.12 in March. On September 8, 2026 they held their largest net short, −104,644 contracts, with copper at $6.74. The next day copper set a record at $6.80, and on September 10 it fell 4.9%.
Both Commercials records came within days of a major turn. The record long marked a bottom, the record short marked a top.
What follows the first week in the zone
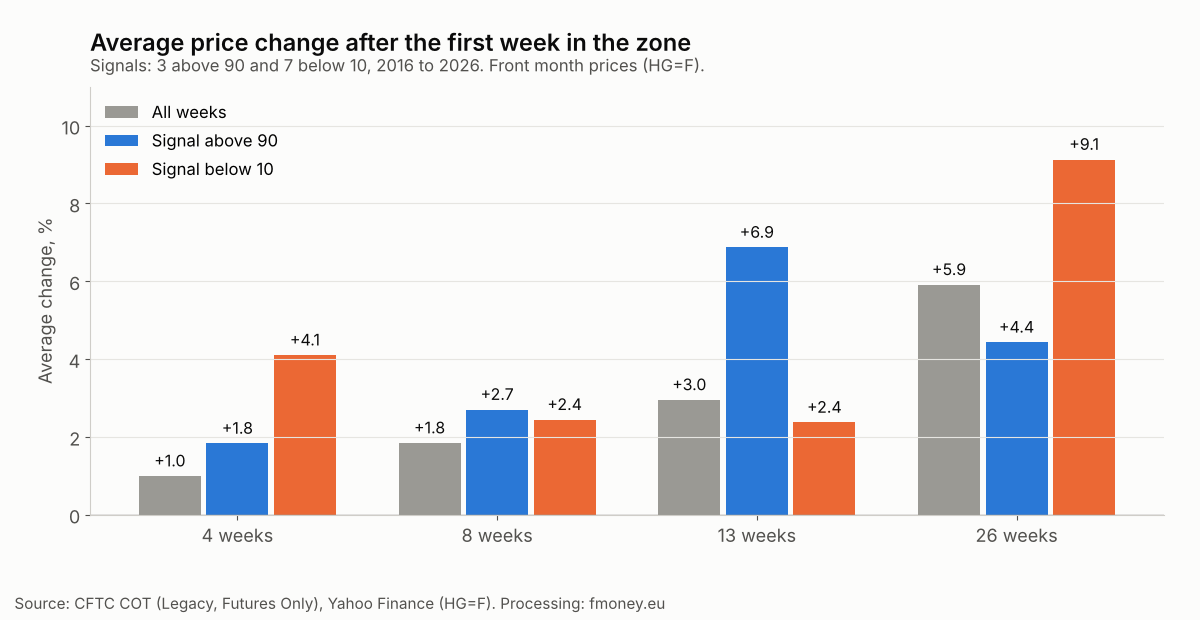
To put numbers on this we ran a backtest. We take the first week the index enters a zone, with at least 26 weeks between two signals of the same type. Entry is the Friday close after the report date (when the CFTC releases it). We measure the price change after 4, 8, 13 and 26 weeks and compare it with the average change across all weeks in the period. We use the continuous front month HG=F without adjustment, because the spread between adjacent copper months is usually below 0.5%.
| Report date | Index | 4 wks | 8 wks | 13 wks | 26 wks |
|---|---|---|---|---|---|
| Above 90 | |||||
| 06/11/2019 | 93.0 | +2.2% | −1.9% | +1.8% | +5.5% |
| 05/09/2023 | 90.2 | +2.0% | +1.4% | −0.1% | −3.6% |
| 01/16/2024 | 90.6 | +1.3% | +8.6% | +18.9% | +11.4% |
| Below 10 | |||||
| 11/01/2016 | 8.0 | +15.7% | +10.5% | +15.4% | +11.4% |
| 09/05/2017 | 7.9 | −0.2% | +2.9% | −2.2% | +3.1% |
| 06/12/2018 | 0.0 | −11.8% | −13.0% | −16.3% | −12.1% |
| 09/01/2020 | 8.6 | −2.2% | −0.1% | +15.3% | +34.2% |
| 04/16/2024 | 7.8 | +12.3% | +1.1% | −6.3% | −3.5% |
| 12/09/2025 | 4.8 | +10.8% | +11.0% | +8.2% | +21.7% |
| 07/21/2026 | 5.5 | +4.1% | +4.7% | +2.5% | n/a |
What the numbers show:
- Above 90 works by the book, but weakly. All three signals were higher after 4 weeks (average +1.8% against +1.0% for all weeks), and the 13 week average is +6.9%. Counting all 9 entries into the zone, 6 were higher after 4 weeks. The strongest came with a catalyst after the signal: the shutdown of the Cobre Panama mine in November 2023 (+9.7% in 8 weeks) and the joint output cut by Chinese smelters in March 2024 (+31.8% in 13 weeks, to $5.12 on May 21).
- Every signal above 90 came with funds at a record short (Managed Money index between 0 and 9). That does not separate winners from losers. What matters is what funds do next: in 5 of 6 successes they bought 12,000 to 87,000 contracts over 8 weeks. In the failures of August 2019 (new US tariffs on China) and August 2023 (China's property crisis and a strong dollar) they kept selling.
- Below 10 is not a sell signal. 4 of 7 signals were higher after 4 weeks (average +4.1%), and the 26 week average is +9.1%. Of 17 entries into the zone, only 6 led to a decline of at least 3% within 8 weeks. Copper is in a long uptrend and Commercials sell into it.
- Declines after below 10 come from a demand shock. The US and China tariffs of June 2018 (−13% in 8 weeks, to $2.56 on August 15), and the Iran war with its energy shock in March 2026 (−8.4% in 4 weeks, a three month low of $5.34 on March 20). A supply shock or tariff expectations kept the price rising despite the extreme short: the 2016 US election (+15.7% in 4 weeks), the 2020 post pandemic rally (+15% in 8 weeks), the short squeeze of May 2024 and the tariff speculation of 2025 and 2026.
For comparison, the average change across all weeks is +1.0% over 4 weeks, +1.8% over 8, +3.0% over 13 and +5.9% over 26 weeks. Copper nearly tripled in ten years, which lifts every average. The sample is small: 3 signals above 90 and 7 below 10. This is context for a decision, not a statistically proven system.
One important detail: the largest one day drop in ten years, −22% on July 31, 2025, when the White House exempted refined copper from tariffs, came with the COT Index at 38.5, nowhere near an extreme.
Seasonality during these periods
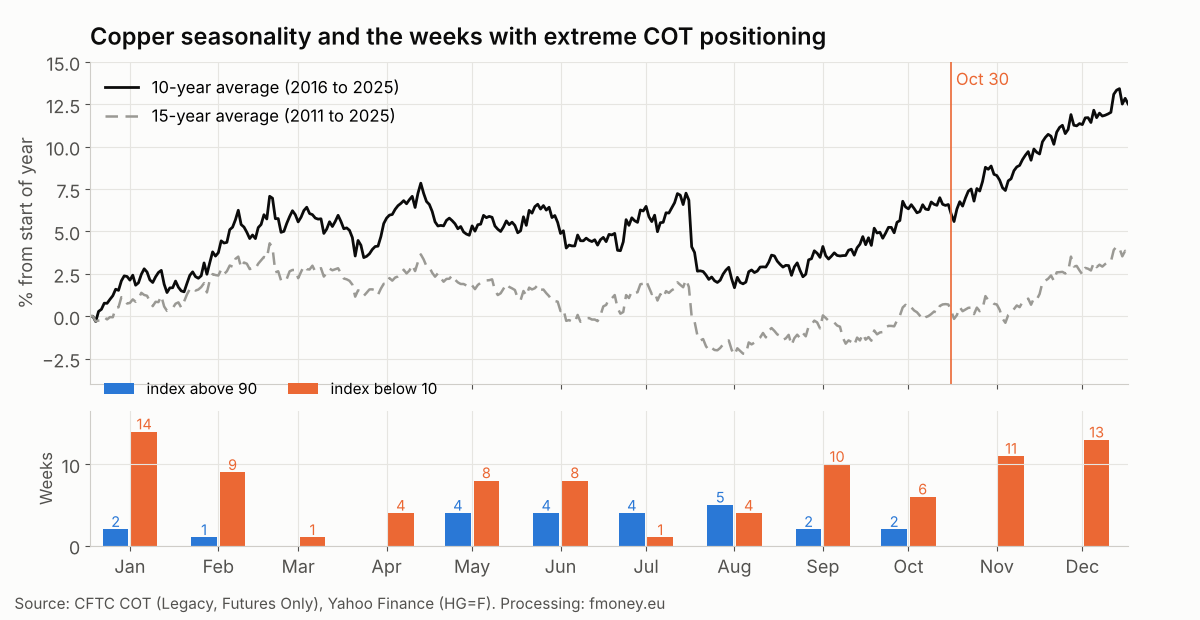
The average seasonal curve for the past ten years (2016 to 2025) is shaped by the uptrend and is positive almost everywhere:
- January to the end of April: a rise to about +6.6%, as China returns from the Lunar New Year and the construction season starts;
- May to the end of August: a decline and chop to about +3% at the end of August;
- September and October: a recovery to about +5.6% at the end of October;
- November and December: the strongest stretch of the year, to about +12.5% at the end of December.
The 15 year curve (2011 to 2025) includes the bear years after 2011. It peaks around March 5 (+4.3%), bottoms around mid August (−2.3%) and ends the year at about +3.6%. Both curves agree on the shape: a weak summer and a strong year end.
Weeks above 90 cluster from May to August (17 of 24), when the price is usually soft. Weeks below 10 cluster from November to February (47 of 89), when the price usually rises.
Comparing the October 30 close with the end of December for each of the past ten years, copper finished higher in 8 of 10 years. The average change is +6.1% and the median +6.0%. The two down years were 2018 (−1.3%) and 2024 (−6.6%). Over 15 years the picture is weaker: higher in 10 of 15 years, +2.8% on average.
Where we are now
According to CFTC data as of October 27, 2026:
- Commercials net position: −53,254 contracts (COT Index 38.0, out of the zone below 10 since October 6);
- 4 week change: Commercials bought 41,587 contracts, and they have covered about 51,000 contracts since the September 8 record;
- Managed Money net position: +40,575 contracts (156 week index 66.8), down from +82,522 on September 22;
- open interest: 337,019 contracts.
The rally of the past year has two drivers. The first is supply: mine setbacks in Indonesia, the DR Congo and Chile cost about 338,000 tons of output in the first half of 2026. The second is the expected US tariff on refined copper: metal keeps flowing into COMEX warehouses, where stocks have topped 700,000 tons. Much of it is hedged with short futures, which also explains the record Commercials short. There is still no tariff decision. BMO does not expect one before the US midterm elections in November, and Macquarie sees January 1 passing without an announcement as the most likely outcome.
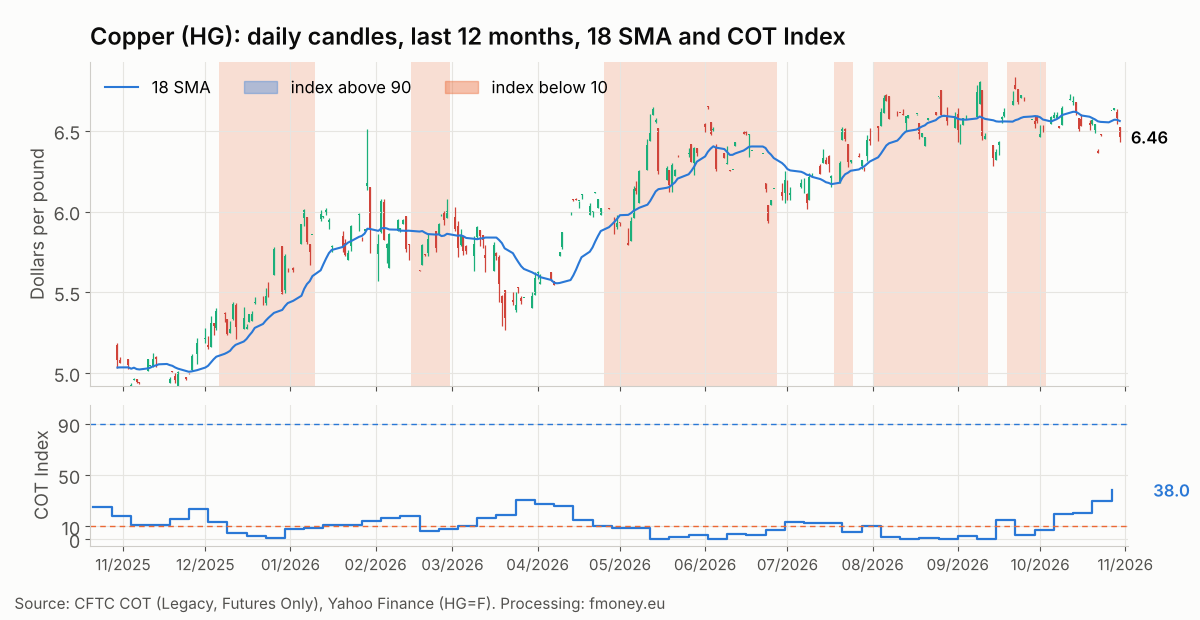
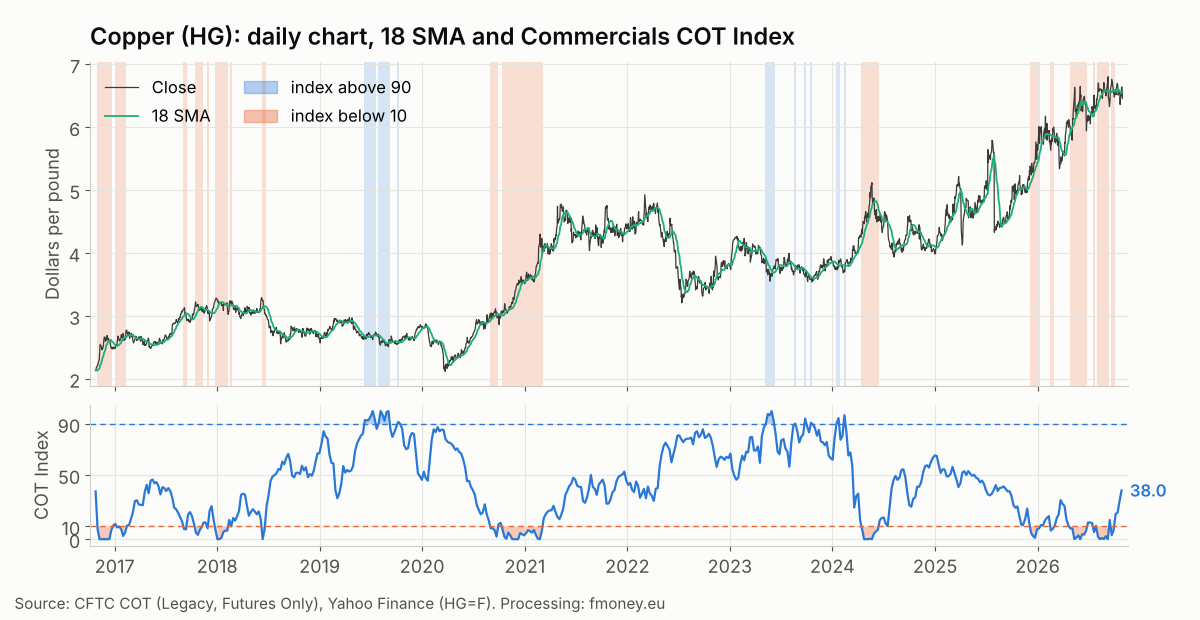
The daily chart shows the whole cycle. From the 12 month low ($4.93 on November 4, 2025) copper climbed to $6.80 on September 9, 2026. There were two declines along the way: in March, during the Persian Gulf war, and on September 10, on the tariff news. The October 30 close was $6.46, 5.1% below the record, 1.5% below the 18 day average ($6.56) and 4.1% above the 200 day average ($6.21).
The three frameworks currently say:
- COT: the index is 38.0 and rising fast as Commercials cover shorts. No signal under our filter. Funds have already sold about half of their long.
- Seasonality: positive into year end, higher in 8 of 10 years.
- Price: sideways between $6.30 and $6.80 since August, above the 200 day average and slightly below the 18 day average.
The scenario we are watching: the record Commercials short marked the top, just as their record long in 2019 marked the bottom. There is no extreme now, and seasonality plus the deficit outside the US support the price. The biggest risk remains the tariff decision. If refined copper is exempted for good, the COMEX premium over London could vanish in a day, as it did on July 31, 2025.
5 mistakes when trading COT extremes in copper
- Selling just because the index is below 10. Of 17 entries into the zone, only 6 led to a decline of at least 3% within 8 weeks. In an uptrend Commercials are almost always short.
- Buying at an index above 90 without a catalyst. Signals above 90 work when funds start covering their short after news. Without that news the rally is weak.
- Ignoring tariffs and the New York to London arbitrage. Since 2025, Commercials positions also reflect the hedge on metal in COMEX warehouses, not only their view on price.
- Waiting for a COT signal before the big crashes. The 22% crash on July 31, 2025 came with the index at 38.5. Policy decisions do not check positioning.
- Large size on a small sample. Ten signals in ten years are not statistics. Use the risk calculator and check open interest.
How we use it in practice
In our strategy, Commercials COT positioning is a mandatory filter: we do not look for longs when Commercials are in the extreme short zone, and vice versa. In copper the filter gives no direction right now, seasonality is positive, and the price is moving sideways below the record. The entry comes from price structure and risk management, not from the index itself.
Frequently asked questions
How many times was the copper COT Index above 90 in ten years?
24 weeks out of 523, in 9 separate periods. The longest lasted 6 weeks each, in the summer of 2019.
How many times was it below 10?
89 weeks in 17 periods. The longest ran from October 13, 2020 to March 2, 2021 (21 weeks).
Why are copper Commercials almost always net short?
Miners and metal merchants sell future output forward and hedge warehouse inventory with short futures. The higher the price and the more metal sits in COMEX warehouses, the bigger their short.
How did you calculate prices and seasonality?
We use the continuous front month HG=F without roll adjustment, because the spread between adjacent months is usually below 0.5%. The charts show the actual price in dollars per pound.
Is this a signal to buy or sell copper now?
No. This is an analysis of historical data. The COT Index is currently in the neutral zone and the filter gives no direction.
Conclusion
Over ten years copper Commercials were at an extreme in about 22% of weeks, almost always in the short zone. Above 90 worked by the book but weakly, and best after news that made funds cover their short. Below 10 is not a sell signal: copper usually keeps rising, and declines come from a demand shock such as tariffs or an energy shock. The Commercials records, however, came close to the turns: the 2019 record long was at the bottom, and the September 2026 record short came one day before the record price. Today Commercials are no longer at an extreme, seasonality is positive, and the main risk is the tariff decision.
You can follow the current COT Index for copper and dozens of other markets in our free demo, while weekly analysis and the full toolset are available in our membership plans.
Sources: CFTC Commitments of Traders (Legacy and Disaggregated, Futures Only), data as of 10/27/2026; Yahoo Finance (HG=F), prices as of 10/30/2026; Mining Weekly (09/10/2026); Bloomberg via finanzen.ch (08/26/2026); IMA, Macquarie and BMO forecasts (10/14/2026); Trading Economics (03/20/2026). Calculations: fmoney.eu. Futures trading involves a high risk of loss. This content is for educational purposes and is not investment advice. Past performance does not guarantee future results.