Bullish News, Falling Price: How to Spot the Trap
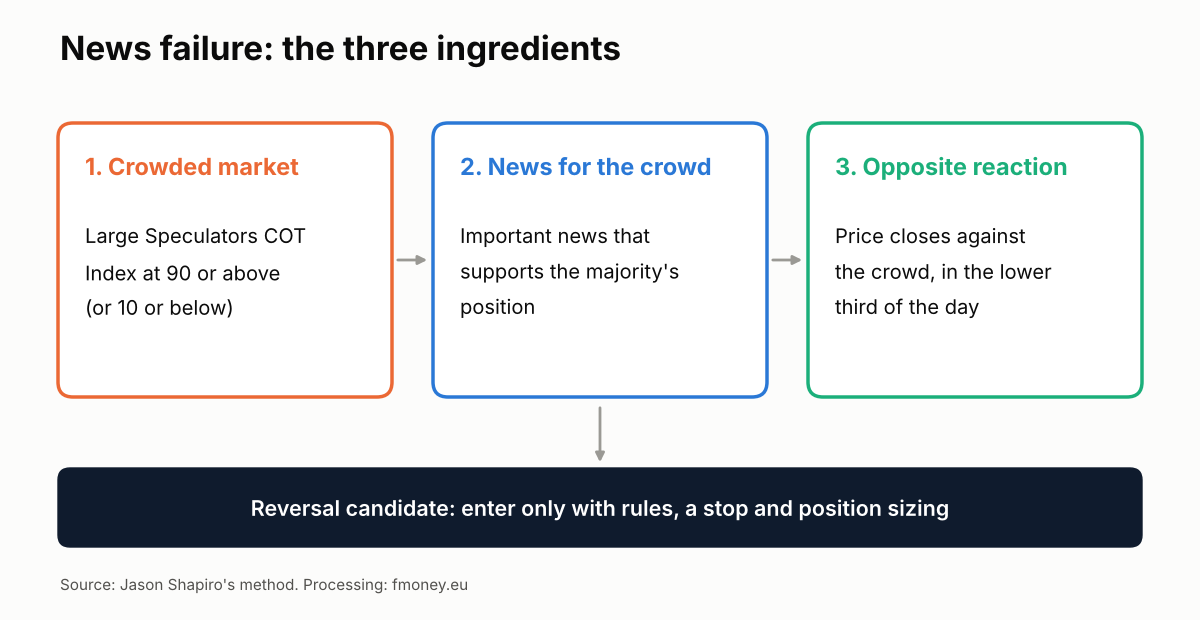
A news failure happens when important news supports the majority's position, yet price moves against it. When this occurs in a market where large speculators have already built a record position in one direction, the reaction often shows that the buyers (or sellers) have run out. The news is not wrong. There is simply no one left to act on it.
- The idea: the information is not in the news but in how price reacts to it.
- The filter: a Large Speculators COT Index of 90 or above (crowd is long) or 10 or below (crowd is short).
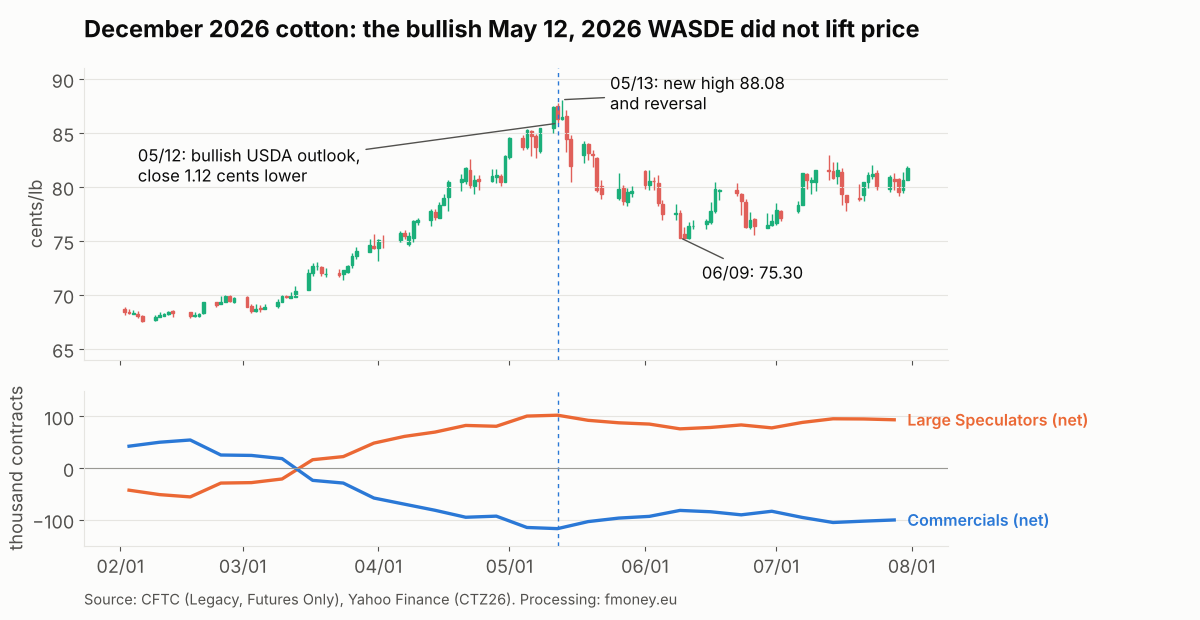
- A real example: cotton, May 12, 2026. A bullish USDA outlook was met with a lower close, and over the next 20 trading days the December contract fell 12.7%.
- The honest warning: a price reversal at a crowded COT reading on its own, without the news, worked in favor of the trade in only 43% of 51 cases. By itself it is not an edge.
Why good news sometimes pushes price lower
Every trader has been there. A report comes out that looks perfect for your position, price jumps for a few minutes and then closes below where it opened. The first reaction is "the market makes no sense." The logic is simple, though: price is moved by orders, not headlines.
When a story has been popular for weeks, most participants who believe in it have already bought. Their positions show up in the CFTC Commitments of Traders (COT) report. If large speculators hold a record net long position, news in their favor does not bring new buyers. It gives those who already bought a chance to sell at a higher price. That is why Jason Shapiro, author of the Crowded Market Report and one of the traders profiled in Jack Schwager's "Unknown Market Wizards," looks not for the news but for its failure.
A crowded market can stay crowded for months. COT positioning tells you where the risk is, not when it will play out. A news failure is the moment the market itself shows that the crowd is exhausted.
The three ingredients of a news failure
1. A crowded market
Problem: "lots of buyers" is a feeling, not a number.
Solution: calculate the COT Index of large speculators (Non-Commercials) over the last 156 weeks. A reading of 90 or above means their net position is close to its three-year high. The setup is stronger when commercials (the hedgers) sit at the opposite extreme. Ready-made indexes are in the free COT Index demo.
2. News that supports the crowd
Problem: the same news can be read two ways.
Solution: pick only important events with a clear direction (WASDE, EIA inventories, an OPEC+ decision, inflation data). Write down in advance how the crowd would read the news and which way price "should" move. If you cannot say it in one sentence, the news is ambiguous and the case is not a failure.
3. A reaction against the crowd
Problem: one red day is not a reversal.
Solution: look for a close against the crowd versus the prior day, in the third of the daily range that goes against the crowd. The strongest version is a reversal from a new short-term extreme: price first makes a new high in the direction of the news and then closes back down.
A real example: cotton on May 12, 2026
Cotton is a textbook case because all three ingredients came together on the same day, and the data is public.
The crowd: from net short to a three-year record in 12 weeks
According to the CFTC report (Legacy, Futures Only), large speculators were net short 55,733 contracts as of February 17, 2026. By May 5, 2026 they were net long 100,682 contracts, with a COT Index of 99. As of May 12, 2026 the net long reached 102,389 contracts, the highest reading of the last 156 weeks (index 100). That is a swing of 158,122 contracts in 12 weeks, and the position equals 30.5% of open interest. Commercials were the mirror image: net short 117,159 contracts, COT Index 0.
Price followed the funds. The December contract (CTZ26) rose from 67.60 cents per pound on February 6, 2026 to 87.40 cents on May 11, 2026, a gain of 29.3%.
The news: a bullish USDA outlook
On May 12, 2026 the USDA released its first balance sheet for the 2026/27 season. For the U.S.: production of 13.3 million bales (600,000 fewer than the previous season), ending stocks of 3.9 million bales versus 4.4 million, the lowest since the 2023/24 season, and an expected season-average farm price of 73 cents per pound versus 63 cents. Globally, the forecast called for production of 116.04 million bales against consumption of 121.69 million.
My interpretation: on paper this is bullish news, because the balance sheet tightens both in the U.S. and worldwide. The crowd was long, so the news supported it, and the expected reaction was higher prices. Alternative reading: analysts at Southern Ag Today described the outlook as closer to neutral, since the change in ending stocks versus the prior season was within 500,000 bales. After a rally of nearly 20 cents, part of the tightening was probably already priced in. That is why my confidence in the "bullish" interpretation is medium, not high.
The reaction: a lower close in the bottom third
The market did not buy the news. According to Barchart, July cotton settled at 86.32 cents, down 145 points, and December at 86.28 cents, down 112 points. The CTZ26 daily range ran from 85.90 to 87.75 cents, and the close sat 20.5% above the low, in the bottom third. The next day price made one last attempt: a new high at 88.08 cents and a reversal to close at 86.46. On May 14 and 15 a sell-off followed, down to 81.91 cents.
| Date | Event | CTZ26 close (cents) |
|---|---|---|
| February 6, 2026 | Low before the rally | 67.60 |
| May 11, 2026 | Day before the report | 87.40 |
| May 12, 2026 | WASDE: bullish outlook, lower close | 86.28 |
| May 13, 2026 | New high at 88.08 and reversal | 86.46 |
| May 15, 2026 | Sell-off | 81.91 |
| June 9, 2026 | 20 trading days after the report | 75.30 |
What followed, and the catch with the entry
Twenty trading days after the report, CTZ26 stood at 75.30 cents, 12.7% below the May 12 close. The interesting part is elsewhere: the two standard entry methods gave different outcomes.
- Entry at the close of the failure day (86.28) with a stop above its high (87.75): on May 13 price reached 88.08 and the stop was hit for a loss of 1.47 cents, about $735 per contract.
- Sell stop order below the low of the failure day (85.90) with a stop above its high (87.75): the order filled on May 14, when price dropped to 83.20. The risk was 1.85 cents, about $925 per contract, and the highest price after the entry through July was 84.81. The stop was never touched.
The lesson is not "the second method is always better." The lesson is that a news failure gives you the direction, while the entry and the stop decide whether you survive the noise around the turn.
Does the reversal work on its own? A check of 51 cases
To avoid drawing conclusions from one good example, we mechanically tested a version of the setup without the news filter. The rules: a Large Speculators COT Index of 90 or above (or 10 or below), a new 20-day high (or low), a close at least 1.5% against the crowd and in the third of the day that goes against it. We covered 16 markets (grains, oilseeds, energy, metals, softs, livestock) from 2015 to 2026, and excluded repeat signals in the same market within 30 days. That leaves 51 cases in 15 markets.
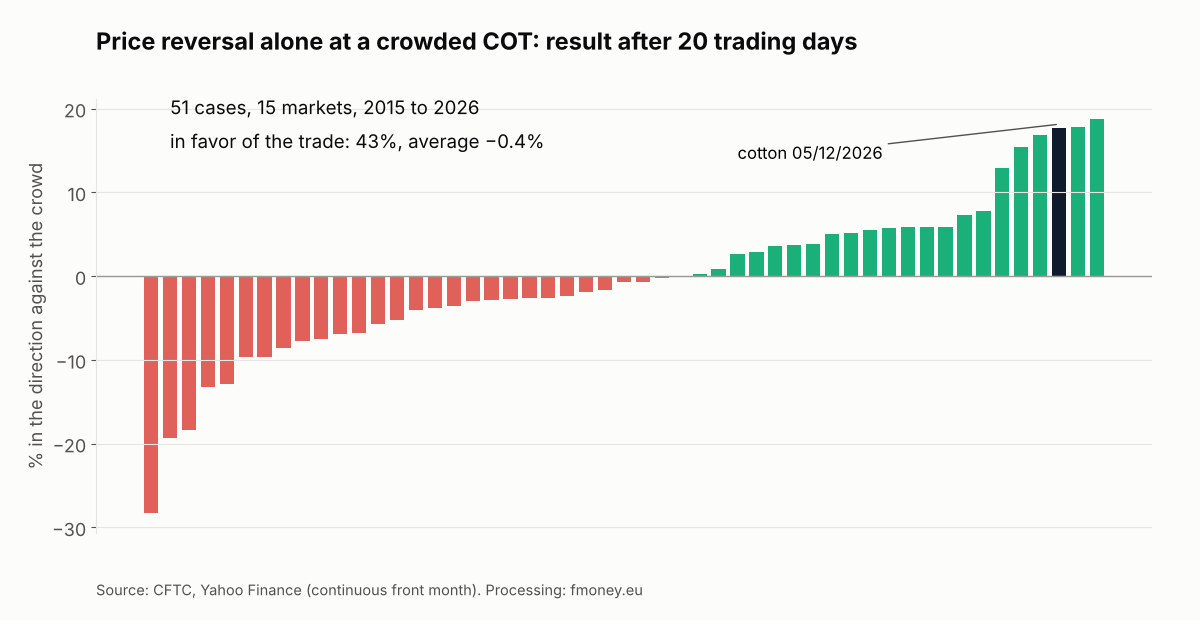
The result is sobering. After 20 trading days price favored the trade in 43% of cases, with an average result of −0.4%. After 40 days the share was 39%, with an average of −1.7%. There are impressive hits like cotton, but there are losses of the same size. In other words, "crowded COT plus a red candle" is not a strategy. The edge, if there is one, comes from the combination: important news, a clear interpretation, a clear reaction and strict risk management.
Test method: continuous front month from Yahoo Finance, with contract roll days cleaned by a simple filter (an opening gap above 2.5% and an intraday move below 1%), and COT data used with a three-day lag to match the actual release date. This is a rough check, not a backtest of a trading system.
How to trade a news failure with rules
Direction
Only against the crowd. If large speculators are at a record long, you look for a short, and vice versa.
Entry
Option 1: a stop order beyond the extreme of the failure day in the direction of the trade (below its low for a short). Option 2: entry at the close of the failure day, as Shapiro prefers. The first requires confirmation; the second gives a better price but gets stopped out more often.
Stop and position size
The stop goes beyond the opposite extreme of the failure day. If the range is wide relative to the average ATR, cut the size, not the stop. Work out the number of contracts with the risk calculator.
Exit and invalidation
Hold the position until COT positioning normalizes toward the middle (around 50), or until the thesis is invalidated: a close back beyond the extreme of the failure day, or new confirming news that the market accepts. More about my rules for entries, stops and exits is in our strategy.
5 mistakes when trading a news failure
- Selling just because COT is extreme. The extreme is a condition, not a signal. The test above shows that without the news context the reversal has no edge.
- Calling every ambiguous headline a failure. If you cannot say in advance how the crowd will read the news, there is no failure.
- Judging the reaction in the first few minutes. What matters is the close and where it sits in the daily range, not the initial spike.
- Placing the stop too tight. Around turning points price often makes one last test of the extreme, as cotton did on May 13.
- Ignoring the commercials. When the hedgers are with the crowd rather than against it, the setup is weaker. Check open interest too: a sharp drop after the reversal shows the crowd is leaving.
Frequently asked questions
What is a news failure?
It is a case where important news supports the majority's position, but price closes in the opposite direction. In a crowded market this often shows that the crowd has run out of buyers (or sellers).
How do I know if a market is crowded?
The simplest measure is the 156-week COT Index of large speculators. A reading of 90 or above means a crowded long, 10 or below a crowded short. The thresholds are a guide, not a mechanical rule.
How often does the setup work?
The mechanical version without news favored the trade in 43% of 51 cases over 20 trading days. That is why the news filter and risk management are not decoration but the core of the method.
Which COT report should I use?
For commodities, Managed Money from the Disaggregated report is the most precise, while Non-Commercials from the Legacy report is the classic choice. When the two disagree, the signal is weaker.
How long can the reversal last?
There is no fixed target. In cotton the decline lasted about a month, after which price partly recovered. The exit is set by the normalization of COT positioning and by your stop rules.
Conclusion
The news everyone is waiting for is rarely news to price. Once the crowd has taken its position, the most valuable information is how the market reacts when it gets exactly what the crowd wants. Cotton in May 2026 showed the setup in its purest form, and the test of 51 cases showed why it should not be traded mechanically. The combination of COT positioning, a clear reading of the news and a strict stop is what turns the idea into a plan.
At fmoney.eu, the COT Index, COT Spread and COT Speed Index for all major futures are updated every week, so you can see which market is crowded before the next big headline hits.
Trading futures and other financial instruments carries a high risk and is not suitable for everyone. This material is educational and is not investment advice. Data: CFTC Commitments of Traders (Legacy, Futures Only), USDA WASDE of May 12, 2026, Yahoo Finance, Barchart. Processing: fmoney.eu.